Figures & data
Figure 1. UBXN1 translocates to mitochondria under mitophagic conditions. (A) HeLa cells transfected with expression constructs for FLAG-UBXN1, mitoDsRed and YFP-PRKN were treated with 25 µM CCCP for 6 h, fixed and stained using mouse anti-FLAG antibodies and imaged by confocal microscopy. Shown are representative images from three independent experiments. Scale bar: 20 µm. (B) Distribution of FLAG-UBXN1 and YFP-PRKN staining was measured by line drawing and Pearson’s correlation was calculated for 10 lines per cell. Shown are boxplots of Pearson’s correlations of three independent experiments with at least 15 cells per condition and experiment. Statistical significance was assessed by Student’s t-test. *** denotes p < 0.001. (C) HeLa cells expressing FLAG-UBXN1 together with mitoYFP-T2A-MYC-PRKN were treated with 25 µM CCCP for the indicated times, fixed and stained using mouse anti-FLAG antibodies and imaged by confocal microscopy. The boxplot represents the quantitative analysis of the mitochondrial:cytosolic UBXN1 ratio from three independent experiments (26 to 97 cells per time point). Statistical significance was tested as above.
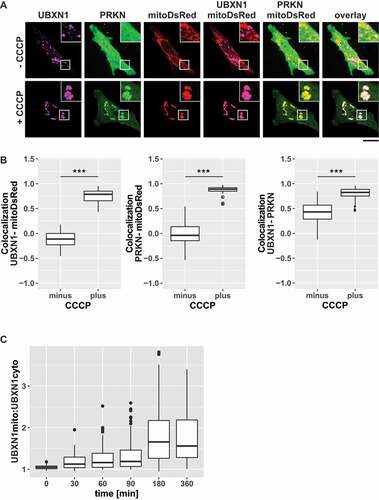
Figure 2. UBXN1 depends on PRKN for mitochondrial translocation, colocalizes and physically interacts with PRKN. (A) Hela cells transfected with expression plasmids for FLAG-UBXN1 and mitoYFP-T2A-MYC-PRKN or mitoYFP and treated with 25 µM CCCP for 6 h or left untreated as control. Cells were fixed and stained using mouse anti-FLAG antibodies and analyzed by confocal microscopy. Shown are representative images of three independent experiments. Scale bar: 20 µm. (B) Pearson’s correlation between FLAG-UBXN1 and mitoYFP was calculated. Box-plots show results of three independent experiments with at least 20 cells per condition. Statistical significance was evaluated using Student’s t-test. n.s. and *** denote p > 0.05 and p < 0.001, respectively. (C) Cells were transfected with expression plasmid for FLAG-UBXN1 and mCherry-PRKN, fixed and stained using anti-FLAG antibodies. The box plot depicts the ratio PRKNUBXN1:PRKNcytosolic of 28 cells from two independent experiments. Determination of the ratio PRKNUBXN1adjacent:PRKNcytosolic (UBXN1 adjacent: 10 pixel left or right and up or down) served as control. Statistical significance was evaluated using Student’s t-test with *** denoting p < 0.001. (D) HeLa cells were transfected with expression plasmids for YFP-PRKN or mCherry-PRKN and untagged UBXN1 and treated with 25 µM CCCP for 6 h or left untreated. Immunoprecipitation was performed using mouse anti-GFP antibodies. Whole cell lysates and precipitates were separated by SDS-PAGE and immunoblotted for PRKN and UBXN1 using rabbit anti-GFP and anti-UBXN1 antibodies, respectively.
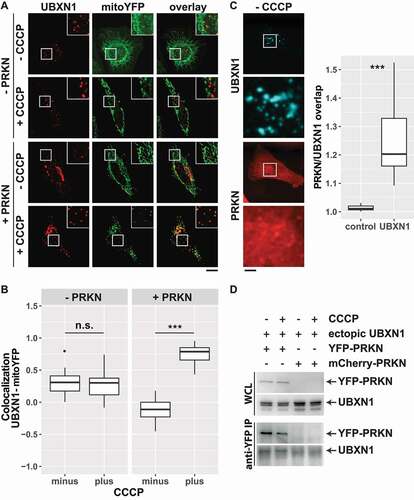
Figure 3. Loss of UBXN1 results in mitochondrial fragmentation and impaired ATP production. (A) HeLa cells were transfected with expression construct for SpCas9 carrying a specific sgRNA targeting the exon 4 of UBXN1 and a repair template for homologous recombination carrying 800 bp left and right homology to UBXN1 as well as secreted Gaussia luciferase (GLuc) under control of the CMV promoter. Following single cell cloning, potential UBXN1 deletion clones were identified by measuring luciferase activity in their cell culture supernatant. (B) Whole cell lysates of wild-type HeLa (WT) and HeLa UBXN1-/- clones 22 (#22) and 71 (#71) were analyzed by western blotting using polyclonal rabbit anti-UBXN1 and mouse anti-GAPDH antibodies. UBXN1 has a molecular weight of about 35 kDa. Please note the complete absence of UBXN1 in clones #22 and #71. (C) HeLa, HeLa UBXN1-/- clone 22 and HeLa UBXN1-/- clone 71 cells were transfected with expression plasmid for mitoDsRed or stained against TOMM20 and analyzed by confocal microscopy. Shown are representative images of three independent experiments. Scale bar: 20 µm. (D) Confocal images of panel C were analyzed to quantify mitochondrial fragment number per cell as well as elongation and interconnectivity of mitochondria in wild-type and UBXN1-/- HeLa cells. Boxplots represent three independent experiments with at least 10 cells per condition. (E) ATP content of wild-type and UBXN1-/- HeLa cells was measured using the ATPGlow assay (Promega) according to manufacturer’ instructions.
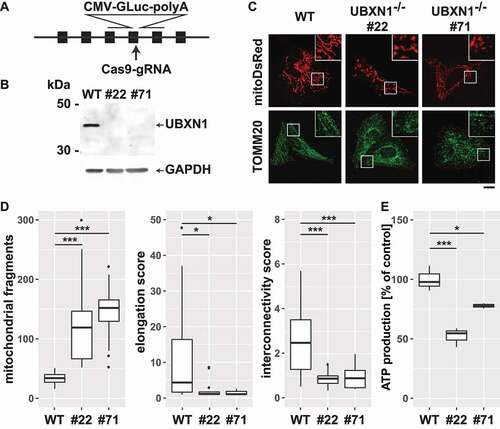
Figure 4. Altered ER-mitochondrial apposition following loss of UBXN1. (A) HeLa (WT), HeLa UBXN1-/- clone 22 (#22) and HeLa UBXN1-/- clone 71 (#71) cells were imaged by transmission electron microscopy. Mitochondria as well as mitochondria-adjacent ER structures (red or yellow) were masked and overlap (yellow) of mitochondrial and ER mask in a 100 nm contact zone (green) was analyzed. ER-mitochondrial apposition is shown in the right most panel (yellow). Scale bar: 500 nm. (B) The boxplot represents the median length of ER-mitochondrial appositions in nm or (C) specific ER-mitochondria apposition from 32 to 41 images (10.8 ± 2.4 mitochondria per image) per condition from two independent experiments. Statistical significance was asserted using non-parametric Kruskal-Wallis followed by Wilcoxon rank sum testing. * p < 0.05, ** p < 0.01, n.s. p > 0.05. (D) Western blotting was used to quantitatively compare MFN1, MFN2, and VDAC1 protein levels between wild-type and UBXN1-/- cells (clone 22 and clone 71). Detection of GAPDH and UBXN1 served as controls. Boxplots represent three biological with two technical replicates each. One-way ANOVA analysis did not reveal statistically significant differences for MFN1, MFN2, or VDAC1 levels between wild-type and UBXN1-/- cells.
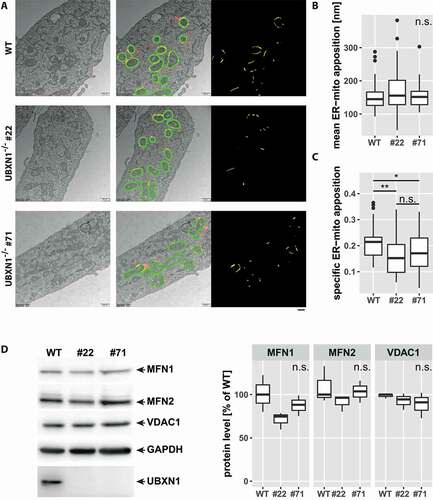
Figure 5. Mitochondrial recruitment of VCP is not influenced by ectopic UBXN1 expression. (A) HeLa cells transfected with expression plasmid for FLAG-UBXN1 or control vector and mitoYFP-T2A-MYC-PRKN, treated with 25 µM CCCP for 90, 180, 360 min or left untreated, were fixed, stained using rabbit anti-FLAG and mouse anti-VCP antibodies and imaged by confocal microscopy. Shown are representative images from three independent experiments after 90 min of CCCP treatment. Scale bar: 20 µm. (B) Mitochondrial translocation of VCP was quantified using line drawings across mitochondria. The plot presents the mean Pearson’s correlation of 73 to 137 cells from three independent experiments. Statistical significance was tested using unbalanced one-way ANOVA.
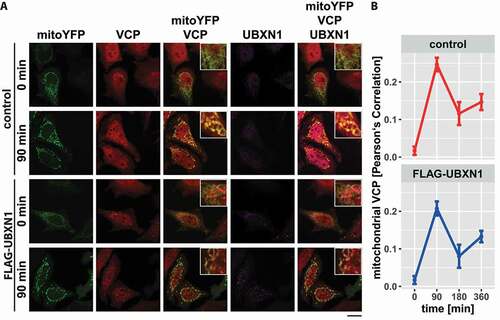
Figure 6. Loss of UBXN1 impacts mitochondrial recruitment of VCP. (A) HeLa (WT), HeLa UBXN1-/- clone 22 (#22) and clone 71 (#71) cells transfected with an expression plasmid for mitoYFP-T2A-MYC-PRKN, treated with 25 µM CCCP for 90, 180, 360 min or left untreated, were fixed, stained using mouse anti-VCP antibodies and imaged by confocal microscopy. Shown are representative images from two independent experiments after 90, 180, and 360 min of CCCP treatment. Scale bar: 20 µm. (B) Mitochondrial translocation of VCP in HeLa was quantified by line drawings across mitochondria of wild-type and UBXN1-/- clone #22 and #71 cells. Shown is the mean Pearson’s correlation between VCP and mitoYFP of 28 to 125 cells per condition from two independent experiments. Statistical significance was tested using unbalanced two-way ANOVA followed by Student’s t-test with “fdr” adjustment for multiple testing.
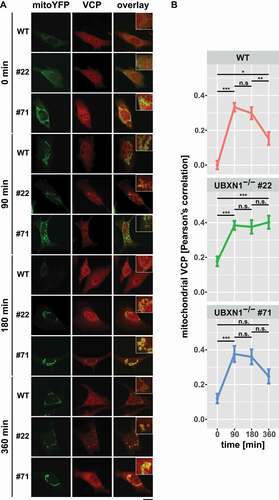
Figure 7. UBX domain of UBXN1 mediates interaction with PRKN. (A) Schematic depicting the domain organization of UBXN1 and mutants of UBXN1 used in this study. (B) HeLa cells transfected with expression plasmids for mitoDsRed, YFP-PRKN and FLAG-UBXN1 (not shown) FLAG-UBXN1ΔUBX or FLAG-UBXN1ΔUBA were treated with 25 µM CCCP for 6 h or left untreated as control. Cells were fixed, stained using mouse anti-FLAG antibodies and analyzed by confocal microscopy. Representative images obtained from three independent experiments are displayed. Scale bar: 20 µm. (C) Mitochondrial translocation of YFP-PRKN was assessed by correlating PRKN and mitoDsRed distribution (Pearson’s correlation) in confocal images from B. Boxplots represent three independent experiments with at least 30 cells per condition. No statistical significant difference between treatment groups was found by unbalanced one-way ANOVA. (D) Immunoprecipitation using anti-GFP antibodies were performed on whole cell lysates (WCL) of HeLa cells transfected with expression plasmids for either YFP-PRKN or mCherry-PRKN and FLAG-UBXN1ΔUBX or FLAG-UBXN1ΔUBA. WCLs, immunopurified and co-purifying proteins were analyzed by western blotting using anti-GFP and anti-UBXN1 antibodies respectively. Due to their size difference, western blots of 9% and 12% SDS-PAGE for analysis of FLAG-UBXN1ΔUBX or FLAG-UBXN1ΔUBA co-purification are shown.
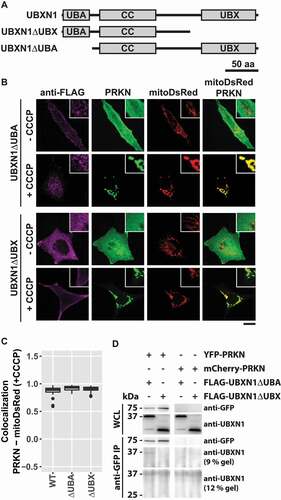
Figure 8. Mitochondrial recruitment of VCP depends on the UBA and UBX domain of UBXN1. (A) HeLa cells transfected with expression plasmids for mitoYFP-T2A-MYC-PRKN, FLAG-UBXN1 (not shown), FLAG-UBXN1ΔUBX or FLAG-UBXN1ΔUBA and treated with 25 µM CCCP for 90 min were fixed and stained using mouse anti-VCP and rabbit anti-FLAG antibodies. Shown are representative experiments of three independent experiments. Scale bar: 20 µm. (B) Colocalization of mitoYFP and VCP or (C) mitoYFP and FLAG-UBXN1, FLAG-UBXN1ΔUBX or FLAG-UBXN1ΔUBA was quantified by Pearson’s correlation in confocal images of A. The boxplots represent three independent experiments with at least 30 cells per condition and experiment. Statistical significance was assessed by one-way ANOVA followed by Student’s t-test with “fdr” adjustment for multiple testing. n.s. – p > 0.05; *** – p < 0.001.
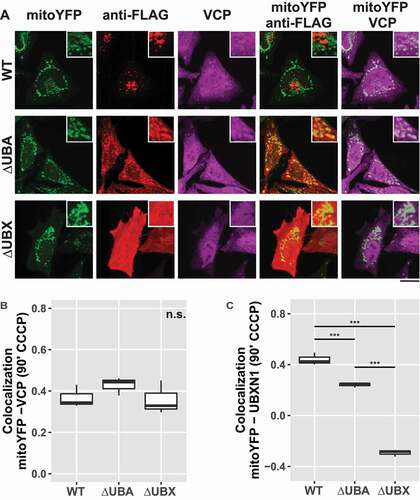
Figure 9. Loss of UBXN1 negatively impacts mitophagic flux. (A) HeLa cells (WT) and HeLa UBXN1-/- clone 22 (#22) and clone 71 (#71) cells transfected with expression plasmids for mCherry-MAP1LC3B and YFP-PRKN and treated with 25 µM CCCP for 6 h were fixed and stained using mouse anti-CYCS antibodies and imaged by confocal microscopy. Shown are representative images from three independent experiments. Scale bar: 20 µm. (B) Loss of mitochondrial mass was determined in images of panel A. Shown is the mean mitochondrial area from 32 to 51 cells per condition from three independent experiments. (C) Overlap between CYCS and MAP1LC3B as determined in images of panel A. Shown are mean percent mitochondrial area overlapping with MAP1LC3B from 32 to 51 cells per condition from three independent experiments. (D) HeLa cells (WT) and cells of HeLa UBXN1-/- clone 22 (#22) and HeLa UBXN1-/- clone 71 (#71) were transfected with expression plasmids for GFP-MAP1LC3B and mCherry-PRKN, treated with 25 µM CCCP or 25 µM CCCP plus 100 nM bafilomycin A1 for 18 h. After fixation, cells were and imaged by confocal microscopy. Scale bar: 20 µm. (E) Using image analysis on confocal images of panel D, the density of GFP-MAP1LC3B dots as measure of autolysosome area per cell was determined. The boxplot represents data from 28 to 40 cells per condition.
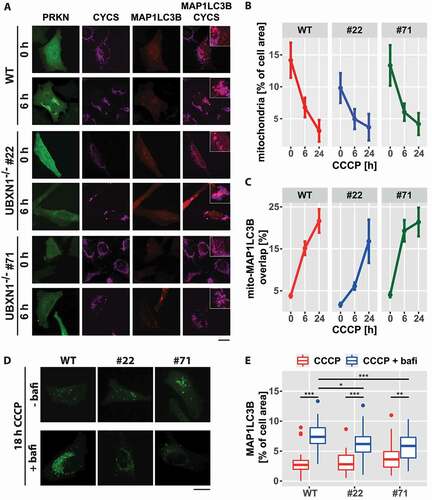
Figure 10. Loss of UBXN1 alters the dynamic of PRKN translocation to mitochondria. (A) HeLa cells and cells of HeLa UBXN1-/- clone 22 (#22) and clone 71 (#71) were transfected with expression plasmids for mitoYFP and mCherry-PRKN and treated with 25 µM CCCP for 30, 60, 90, 180, 360 and 480 min or left untreated, fixed and imaged by confocal microscopy. Shown are representative images from three independent experiments for untreated cells, or cells after 90 and 360 min of CCCP treatment. Scale bar: 20 µm. (B) Colocalization of mitoYFP and mCherry-PRKN was measured by line drawing. Shown are the mean Pearson’s correlations of three independent experiments with 53 to 115 cells per condition from three independent experiments. Statistical significance was determined using unbalanced two-way ANOVA followed by Student’s t-test with “fdr” to account for multiple testing. (C) Translocation of PRKN to mitochondria was analyzed as in B. Shown are density plots scaled to 100%. A gate was set at 0.25 to distinguish cytosolic from mitochondrial PRKN. The gate labels correspond to the percentage of cells contained in each gate.
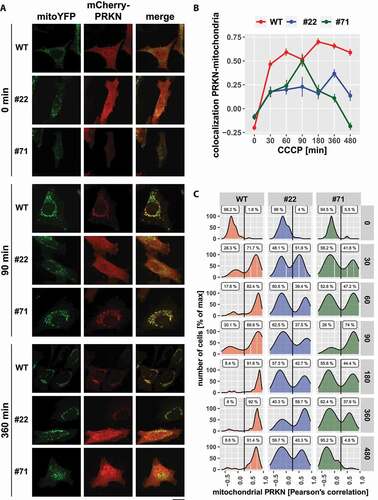
Figure 11. Ectopic expression of the mitochondrial VCP cofactor UBXN6 promotes PRKN translocation in cells lacking UBXN1. (A) HeLa cells (WT) and cells of HeLa UBXN1-/- clone 22 (#22) and clone 71 (#71) were transfected with expression plasmids for FLAG-UBXN6 or control vector, mitoYFP and mCherry-PRKN, treated with 25 µM CCCP for 8 h, fixed, stained using rabbit anti-FLAG antibodies and imaged by confocal microscopy. Shown are representative images from two independent experiments. The overlay panel displays mitoYFP and mCherry-PRKN. Scale bar: 20 µm. (B) Distribution of mitoYPF and mCherry-PRKN staining was measured by line drawing. Shown are boxplots of Pearson’s correlations of two independent experiments with 18 to 33 cells per condition. Statistical significance was assessed by unbalanced two-way ANOVA with Student’s t-test applying “fdr” correction to account for multiple testing.
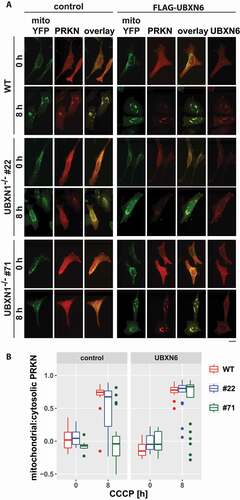
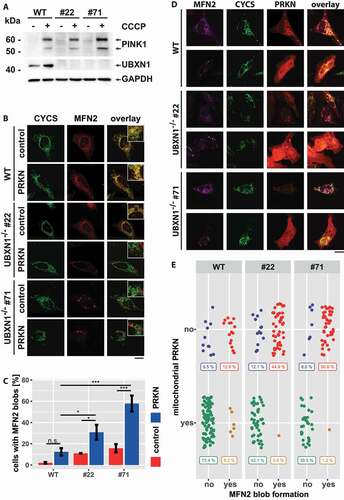
Figure 12. Loss of UBXN1 leads to para-mitochondrial accumulation of MFN2 interfering with PRKN translocation. (A) wild-type (WT) and UBXN1-/- HeLa cells (#22 and #71) without ectopic PRKN expression were treated with 25 µM CCCP for 6 h. Whole cell lysates were analyzed by western blotting using anti-PINK1, anti-UBXN1 and anti-GAPDH antibodies. (B) wild-type (WT) and HeLa UBXN1-/- clone 22 (#22) and clone 71 (#71) cells were transfected with an expression plasmid for mCherry-PRKN or control vector, fixed, stained using rabbit anti-MFN2 antibodies and mouse anti-CYCS antibodies and imaged by confocal microscopy. Shown are representative images from three independent experiments. Scale bar: 20 µm. (C) Percentage of cells with MFN2 blobs in mCherry-PRKN or control transfected wild-type, HeLa UBXN1-/- clone 22 and clone 71 cells. The bar graph shows data from three independent experiments with 28 to 68 cells per condition. Statistical significance was tested by unbalanced two-way ANOVA followed by Student’s t-test with “fdr” adjustment for multiple testing. (D) HeLa cells and cells of HeLa UBXN1-/- clone 22 (#22) and clone 71 (#71) were transfected with expression plasmid for mCherry-PRKN and treated for 60 min with 25 µM CCCP, fixed, stained using rabbit anti-MFN2 antibodies and mouse anti-CYCS antibodies and imaged by confocal microscopy. Shown are representative images from three independent experiments. Scale bar: 20 µm. (E) Dot blot to depict correlation between MFN2 blob formation and PRKN translocation to depolarized mitochondria in cells of panel D. Data shown are derived from three independent experiments with 81 to 116 cell per condition. Statistical significance was ascertained using the chi-squared test.