Figures & data
Figure 1. Antiadipogenic effect of G. cambogia extract and the related protein expression in 3T3-L1 preadipocytes during differentiation. (A) Effect of G. cambogia extract (Ga, 300 μg/ml), FMK (3 μM) and stattic (5 μM) on RPS6KA1 and STAT3 phosphorylation in MDI-induced 3T3-L1 preadipocytes (differentiation started cells) for the indicated times (n = 4 per group). Con: MDI-untreated cells, MDI: MDI-treated cells. **p < 0.01 vs. Con, ##p < 0.01 vs. MDI. (B) Kinase activity of MAPK3/ERK1 and JAK2 in response to G. cambogia extract (n = 4 per group). The active MAPK3/ERK1 and JAK2 enzymes were used to assess kinase activity in the presence or absence of G. cambogia extract at the indicated concentrations in vitro. *p < 0.05 and **p < 0.01 vs. each control. (C) Effect of G. cambogia extract (300 μg/ml), FMK (3 μM) and stattic (5 μM) on CEBPA and PPARG expression in mature 3T3-L1 adipocytes (fully differentiated adipocytes) (n = 4 per group). Con: undifferentiated cells, Diff: mature 3T3-L1 adipocytes. **p < 0.01 vs. Con, ##p < 0.01 vs. Diff. (D) Effect of G. cambogia extract (300 μg/ml) on lipid accumulation in mature 3T3-L1 adipocytes at the indicated time points. The time table (upper) and representative images of Oil red O staining (below) are presented. EGCG (50 μM) was used as a positive control (n = 15 per group). Scale bar: 50 μm. (E) Effect of G. cambogia extract (300 μg/ml) on CEBPA and PPARG expression in mature 3T3-L1 adipocytes at the indicated time points (n = 4 per group). *p < 0.05 and **p < 0.01 vs. each group. The data are the mean ± S.D.
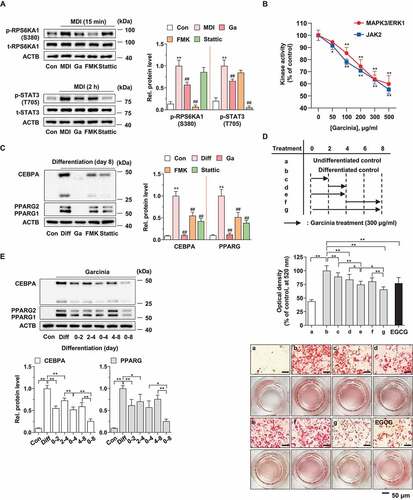
Figure 2. Effect of G. cambogia extract-induced RPS6KA1 and STAT3 inhibition on CEBPB regulation in MDI-induced 3T3-L1 preadipocytes during differentiation. (A) Effect of G. cambogia extract (300 μg/ml) on CEBPB (LAP* and LAP) and CEBPD expression in MDI-induced 3T3-L1 preadipocytes for the indicated times (n = 4 per group). MDI: MDI-treated cells. Ex.: Exposure. *p < 0.05 and **p < 0.01 vs. each control. n.s.: not significant. (B) Effect of G. cambogia extract (0–300 μg/ml) on CEBPB (LAP* and LAP) and CEBPD expression in MDI-induced 3T3-L1 preadipocytes after 48 h (n = 4 per group). Con: MDI-untreated cells. **p < 0.01 vs. Con, ##p < 0.01 vs. MDI. (C) Effect of Rps6ka1 and Stat3 knockdown on CEBPB (LAP* and LAP) and CEBPD expression in 3T3-L1 differentiated cells. (D) Effect of FMK (3 μM) and stattic (5 μM) on CEBPB (LAP* and LAP) and CEBPD expression in MDI-induced 3T3-L1 preadipocytes for the indicated duration (n = 4 per group). *p < 0.05 and **p < 0.01 vs. each control. (E) Effect of G. cambogia extract, FMK (3 μM) and stattic (5 μM) on CREB phosphorylation in MDI-induced 3T3-L1 preadipocytes after 60 min (n = 4 per group). **p < 0.01 vs. Con, ##p < 0.01 vs. MDI. (F) Effect of G. cambogia extract (300 μg/ml) on the Cebpb transcript level in MDI-induced 3T3-L1 preadipocytes for the indicated times (n = 9 per group). **p < 0.01 vs. each control. (G) Effect of G. cambogia extract (300 μg/ml) on the CEBPB protein half-life in MDI-induced 3T3-L1 preadipocytes. After treatment of G. cambogia extract in cells for 42 h, translation inhibitor cycloheximide (CHX, 1.5 μg/ml) was coincubated with the indicated times (n = 4 per group). The data are the mean ± S.D.
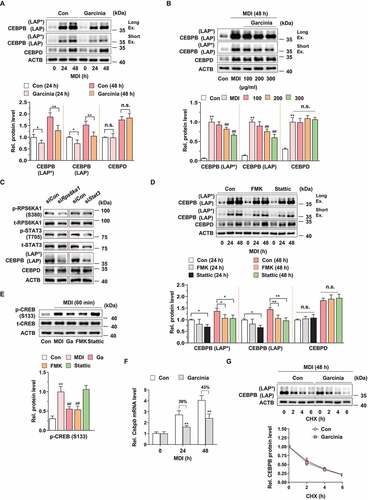
Figure 3. Effect of G. cambogia extract on autophagic flux and autophagy-related gene expression in 3T3-L1 preadipocytes during differentiation. (A) Effect of G. cambogia extract (300 μg/ml) on CEBPB (LAP* and LAP), BECN1, ATG7, ATG3, LC3 and SQSTM1 expression in 3T3-L1 differentiated cells for the indicated times (n = 4 per group). *p < 0.05 and **p < 0.01 vs. each control. (B) Effect of G. cambogia extract (0–300 μg/ml) on BECN1, ATG7, ATG3, LC3 and SQSTM1 expression in 3T3-L1 differentiated cells for 72 h (n = 4 per group). (C) Fluorescence photographs and quantification data of mCherry-GFP-LC3 puncta in 3T3-L1 differentiated cells in response to G. cambogia extract (Ga, 300 μg/ml) for 72 h, LY294002 (LY, 10 μM), 3-methyladenine (3-MA, 0.5 mM), bafilomycin A1 (Baf, 100 μM) and rapamycin (Ra, 10 nM) for 24 h. The average number of autophagosomes (yellow) and autolysosomes (red) per cell was determined and analyzed (n = 9 per group). Scale bar: 20 μm. **p < 0.01 vs. each control. (D) Effect of G. cambogia extract (Ga, 300 μg/ml, 72 h), LY294002 (LY, 10 μM, 24 h), 3-methyladenine (3-MA, 0.5 mM, 24 h), bafilomycin A1 (Baf, 100 μM, 24 h) and rapamycin (Ra, 10 nM, 24 h) on LC3 and SQSTM1 expression in 3T3-L1 differentiated cells (n = 4 per group). *p < 0.05 and **p < 0.01 vs. each control. (E) Effect of G. cambogia extract (300 μg/ml) on the transcript levels of Becn1, Atg7, Atg3, Lc3 and Sqstm1 in 3T3-L1 differentiated cells for the indicated times (n = 9 per group). **p < 0.01 vs. each control. The data are the mean ± S.D.
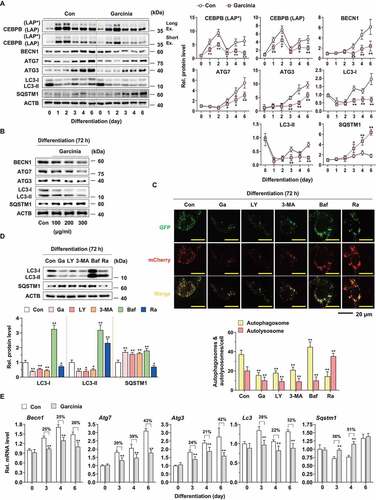
Figure 4. Effect of CEBPB, RPS6KA1 and STAT3 regulation on autophagy-related protein expression in 3T3-L1 preadipocytes during differentiation. (A) Effect of Cebpb knockdown on CEBPB (LAP* and LAP), CEBPA, PPARG, BECN1, ATG7, ATG3, LC3, SQSTM1, ATG4B and ATG12–ATG5 expression in 3T3-L1 differentiated cells for 72 h. (B) Effect of Rps6ka1 and Stat3 knockdown on CEBPA, PPARG, BECN1, ATG7, ATG3, LC3, SQSTM1, ATG4B and ATG12–ATG5 expression in 3T3-L1 differentiated cells for 72 h (n = 4 per group). **p < 0.01 vs. each control. n.s.: not significant. (C) Effect of FMK (3 μM) and stattic (5 μM) on BECN1, ATG7, ATG3, LC3, SQSTM1, ATG4B and ATG12–ATG5 expression in 3T3-L1 differentiated cells for the indicated times (n = 4 per group). *p < 0.05 and **p < 0.01 vs. each control. The data are the mean ± S.D. (D) Schematic illustrating the interaction of CEBPB and autophagy with RPS6KA1 and STAT3. The dotted line means undisclosed facts.
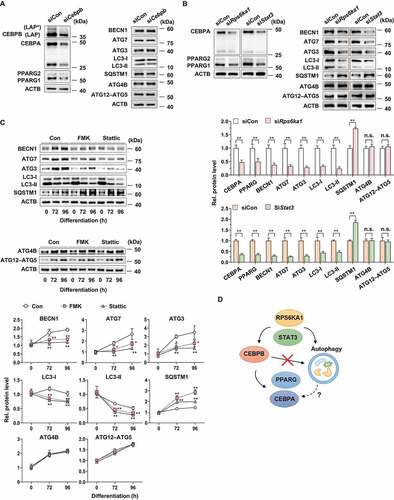
Figure 5. Effect of G. cambogia extract on KLF3 expression in 3T3-L1 preadipocytes during differentiation. (A) Effect of G. cambogia extract (300 μg/ml) on KLF3, CEBPA and PPARG in 3T3-L1 differentiated cells for the indicated times (n = 4 per group). **p < 0.01 vs. each control. (B) Effect of G. cambogia extract (0–300 μg/ml) on CEBPB, KLF3, CEBPA and PPARG expression in 3T3-L1 differentiated cells after 72 h (n = 4 per group). *p < 0.05 and **p < 0.01 vs. Con. (C) Effect of FMK (3 μM) and stattic (5 μM) on CEBPB, KLF3, CEBPA and PPARG expression in 3T3-L1 differentiated cells for the indicated times (n = 4 per group). *p < 0.05 and **p < 0.01 vs. each control. (D) Effect of Cebpb, Rps6ka1 and Stat3 knockdown on KLF3 expression in 3T3-L1 differentiated cells after 72 h (n = 4 per group). **p < 0.01 vs. siCon. n.s.: not significant. (E) Effect of G. cambogia extract (300 μg/ml) on Klf3 transcript levels in 3T3-L1 differentiated cells for the indicated times (n = 9 per group). (F) Effect of G. cambogia extract (300 μg/ml) on the KLF3 protein half-life in 3T3-L1 differentiated cells after 72 h. After treatment of G. cambogia extract in cells, cycloheximide (CHX, 1.5 μg/ml) was coincubated with the indicated times (n = 4 per group). **p < 0.01 vs. each control. (G) Effect of G. cambogia extract (Ga, 300 μg/ml) for 72 h and MG132 (10 μM) and 3-MA (0.5 mM) for 24 h on SQSTM1 and KLF3 expression in 3T3-L1 differentiated cells (n = 4 per group). **p < 0.01 vs. Con. The data are the mean ± S.D.
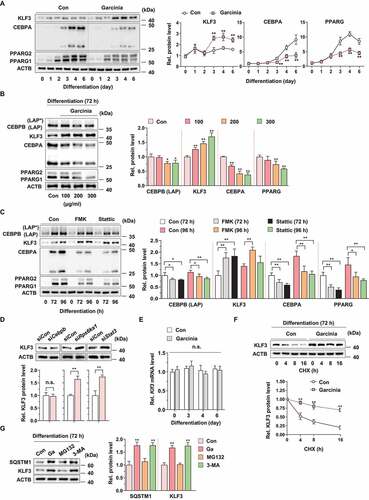
Figure 6. Effect of G. cambogia extract on SQSTM1-mediated selective autophagic degradation of KLF3 in 3T3-L1 preadipocytes during differentiation. (A) Interaction of SQSTM1 and KLF3 in 3T3-L1 differentiated cells treated with G. cambogia extract (Ga, 300 μg/ml), FMK (3 μM) and stattic (5 μM) for 72 h. Coimmunoprecipitation (IP) was used to analyze the level of SQSTM1 that physically interacted with KLF3. The lysates were immunoprecipitated with anti-KLF3 and anti-IgG antibodies, and the precipitates were analyzed by western blotting using antibodies against SQSTM1 and KLF3 (n = 4 per group). (B) Effect of Sqstm1 knockdown on the interaction of SQSTM1 and KLF3 in 3T3-L1 differentiated cells treated with G. cambogia extract (300 μg/ml). Sqstm1 knockdown cells were treated with G. cambogia extract (300 μg/ml) for 72 h (n = 4 per group). (C) Effect of Sqstm1 knockdown on LC3, SQSTM1, KLF3, CEBPA and PPARG expression in 3T3-L1 differentiated cells treated with G. cambogia extract (300 μg/ml) for 72 h in the presence or absence of rapamycin (Ra, 10 nM) for 24 h (n = 4 per group). (D) Fluorescence photographs (left) and quantification data (below) of LC3 and KLF3 in Sqstm1 knockdown cells treated with G. cambogia extract (300 μg/ml) for 72 h in the presence or absence of rapamycin (10 nM) for 24 h. The fluorescence intensity of FITC (i.e., LC3) and TRITC (i.e., KLF3) was quantified using ImageJ software and colocalization (yellow dots indicated by white arrows) of FITC and TRITC per cell was determined and analyzed (n = 5 per group). Scale bars: 5 μm (E) Effect of Sqstm1 knockdown on G. cambogia extract- and rapamycin-mediated lipid accumulation in mature 3T3-L1 adipocytes (n = 12 per group). During full differentiation (day 0–8), cells were treated with G. cambogia extract (300 μg/ml), and rapamycin (10 nM) was added at day 3–8. Con: undifferentiated cells, Diff: mature 3T3-L1 adipocytes. *p < 0.05 and **p < 0.01 vs. each group. n.s.: not significant. The data are the mean ± S.D.
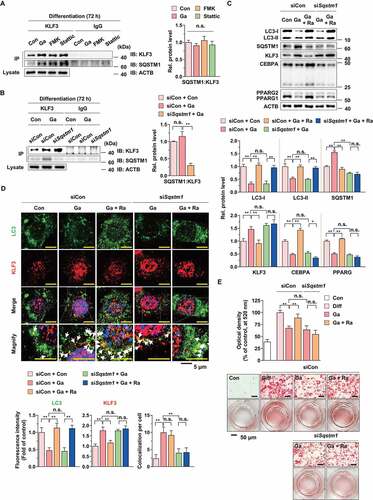
Figure 7. Effect of G. cambogia extract on KLF3 and CTBP2 interaction to regulate adipogenic factors in 3T3-L1 preadipocytes during differentiation. (A) Effect of G. cambogia extract (0–300 μg/ml) on CTBP2 expression in 3T3-L1 differentiated cells for 72 h (n = 4 per group). n.s.: not significant. (B) Effect of FMK (3 μM) and stattic (5 μM) on CTBP2 expression in 3T3-L1 differentiated cells for the indicated times (n = 4 per group). (C) Physical interaction of KLF3 and CTBP2 in 3T3-L1 differentiated cells treated with G. cambogia extract (Ga, 300 μg/ml), FMK (3 μM) and stattic (5 μM) for 72 h. Coimmunoprecipitation (IP) was used to analyze the interaction of KLF3 and CTBP2. The lysates were immunoprecipitated with anti-KLF3 and anti-IgG antibodies, and the precipitates were analyzed by western blotting using antibody against CTBP2 (n = 4 per group). (D) Fluorescence photographs (left) and quantification data (right) of KLF3 and CTBP2 in 3T3-L1 differentiated cells treated with G. cambogia extract (300 μg/ml), FMK (3 μM) and stattic (5 μM) for 72 h. The fluorescence intensity and colocalization of TRITC (i.e., KLF3) and FITC (i.e., CTBP2) were quantified using ImageJ software. Colocalization was analyzed using the Pearson correlation coefficient. Scale bars: 5 μm. (n = 6 per group). **p < 0.01 vs. Con, n.s.: not significant. (E) Effect of G. cambogia extract (300 μg/ml) on the transcript levels of Cebpa and Pparg in 3T3-L1 differentiated cells for the indicated times (n = 9 per group). **p < 0.01 vs. each control. The data are the mean ± S.D.
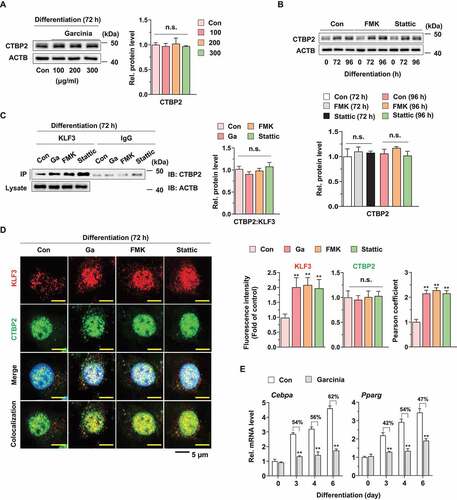
Figure 8. Effect of G. cambogia extract on HFD-induced obesity in mice. (A) Effect of G. cambogia extract on high-fat diet (HFD)-induced body weight, and (B) weight gain, caloric intake and energy efficiency rate (EER) (n = 8 per group). Body weight and food intake were monitored twice per week for 8 weeks. Normal diet (ND)-fed mice served as a negative control for high-fat accumulation, and orlistat (20 mg/kg) was used as a positive control for antiobesity effects. (C and D) Effect of G. cambogia extract on HFD-induced adipose fat tissue mass and (E) quantification data (n = 8 per group). eWAT: epididymal white adipose tissue; mWAT: mesenteric white adipose tissue; rWAT: retroperitoneal white adipose tissue; iWAT: inguinal subcutaneous white adipose tissue; BAT: brown adipose tissue. (F) Effect of G. cambogia extract on adipocyte size in HFD-induced eWAT and iWAT. H&E staining of eWAT and iWAT was performed for histological analysis, and adipocyte size was estimated using ImageJ software Adiposoft. Scale bars: 50 μm. (G) Serum analysis of triglyceride and total cholesterol levels (n = 7 per group). *p < 0.05, **p < 0.01 vs. ND-fed mice, #p < 0.05 and ##p < 0.01 vs. HFD-fed mice. n.s.: not significant. The data are the mean ± S.D.
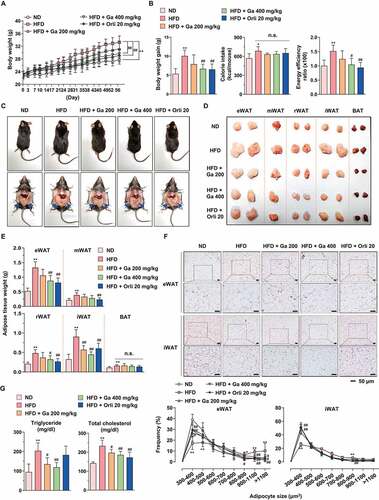
Figure 9. Effect of G. cambogia extract on the identified targets in HFD-induced adipose tissues. (A and B) Effect of G. cambogia extract on phospho- and total-RPS6KA1, phospho- and total-STAT3, LC3, SQSTM1, KLF3, CEBPA and PPARG expression of eWAT and iWAT in ND-fed, HFD-fed and HFD-fed mice administered a high dose of G. cambogia extract (400 mg/kg) (n = 6 per group). (C) Correlations between phospho-RPS6KA1, phospho-STAT3 and KLF3 protein expression in eWAT and iWAT (n = 6 per group). Each point represents one sample. (D and E) Immunofluorescence analysis of phospho-RPS6KA1, phospho-STAT3 and KLF3 expression in eWAT and iWAT (n = 4 per group). Nuclei were stained with DAPI (blue), and white arrows indicate phospho-RPS6KA1, phospho-STAT3 and KLF3 colocalization with DAPI. Scale bars, 50 μm. **p < 0.01 vs. ND-fed mice, #p < 0.05 and ##p < 0.01 vs. HFD-fed mice. The data are the mean ± S.D.
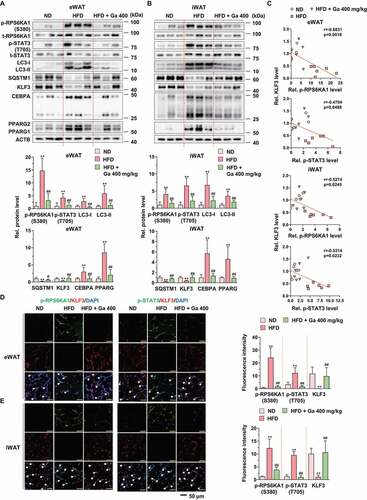
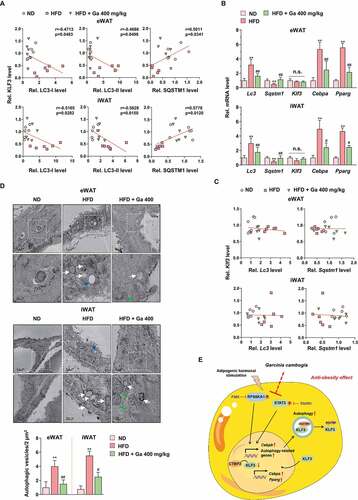
Figure 10. Analysis of the adipose tissues in the animal model. (A) Correlations between LC3-I, LC3-II, SQSTM1 and KLF3 protein expression in eWAT and iWAT (n = 6 per group). Each point represents one sample. (B) Lc3, Sqstm1, Klf3, Cebpa and Pparg transcript levels of eWAT and iWAT in ND-fed, HFD-fed and HFD-fed mice administered a high dose of G. cambogia extract (400 mg/kg) (n = 6 per group). (C) Correlations between Klf3, Lc3 and Sqstm1 transcript levels in eWAT and iWAT (n = 6 per group). Each point represents one sample. (D) Representative transmission electron micrographs of eWAT and iWAT in ND-fed, HFD-fed and HFD-fed mice administered a high dose of G. cambogia extract (400 mg/kg). The lower images are the enlarged representations of the boxed regions of the upper images. Scale bars: upper, 0.5 μm; lower, 200 nm. Autophagic vesicles are highlighted by white arrows and were quantified by counting the number of vesicles per 2 μm2 microscopic field in 4 randomly selected fields (n = 4 per group). Blue arrow: lipid droplet; green arrow: mitochondria. (E) Proposed mechanism for the antiobesity effect of G. cambogia extract in adipose tissue. **p < 0.01 vs. ND-fed mice, #p < 0.05 and ##p < 0.01 vs. HFD-fed mice. n.s.: not significant. The data are the mean ± S.D.