Figures & data
Figure 1. PIP attenuates olfactory dysfunction in SNCA transgenic mice. (A) Male TG mice were orally treated with PIP (25, 50 and 100 mg/kg) or CoQ10 (200 mg/kg) for 6 weeks. (B–G) Buried food pellet (B), surface pellet (C), sucrose preference (D) and open field (E–G) tests were used to assess olfactory function. Data are expressed as means ± SEM (one-way analysis of variance). ##P < 0.01, ###P < 0.001, ####P < 0.0001 vs. WT; ****P < 0.0001 vs. TG (n = 10–19). (H) The buried food pellet test was used to assess olfactory function with age. Data are expressed as means ± SEM (two-way analysis of variance). *P < 0.05, **P < 0.01, ****P < 0.0001 (n = 5–10).
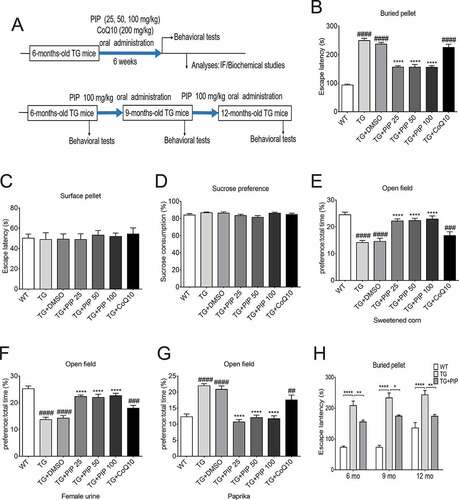
Figure 2. PIP delays motor deficits and abrogates dopamine reduction in SNCA transgenic mice. Male TG mice were orally treated with PIP (100 mg/kg) until 12-months-old. (A–B) Rotarod (A) and pole (B) tests were used to assess motor function. Data are expressed as means ± SEM (two-way analysis of variance). ***P < 0.001, ****P < 0.0001 (n = 5–10). (C) TH (tyrosine hydroxylase) expression in the striatum and SN was assessed by immunohistochemistry. Scale bar: 500 µm. (D–E) Quantitative analysis of TH-positive neurons in the striatum (D) and SN (E). (F) Dopamine (DA) content in the striatum was assessed by HPLC. Data are expressed as means ± SD (one-way analysis of variance). ###P < 0.001, ####P < 0.0001 vs. WT; **P < 0.01, ***P < 0.001 vs. TG (n = 3).
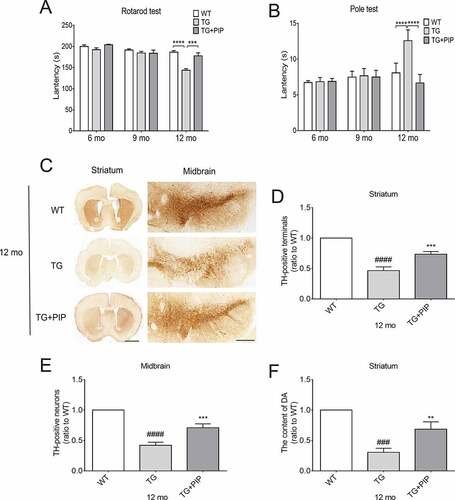
Figure 3. PIP promotes the degradation of pathological SNCA in the OB of SNCA transgenic mice. (A) Immunoblot results of Hs-SNCA levels in the RIPA soluble and insoluble fractions from OB. (B–C) Quantitative analysis of Hs-SNCA level in the RIPA soluble (B) and insoluble fractions (C) level in OB. ACTB was used as a loading control. The normalized ratio for the TG group was taken as 1. (D) Representative immunofluorescence images from mice slices of OB treated with and without PK. Scale bar: 75 µm, zoom scale bar: 10 µm. (E) Hs-SNCA mRNA expression after PIP treatment was assessed by RT-PCR. Data are expressed as means ± SD (one-way analysis of variance). **P < 0.01, ***P < 0.001, ****P < 0.0001 vs. TG (n = 3).
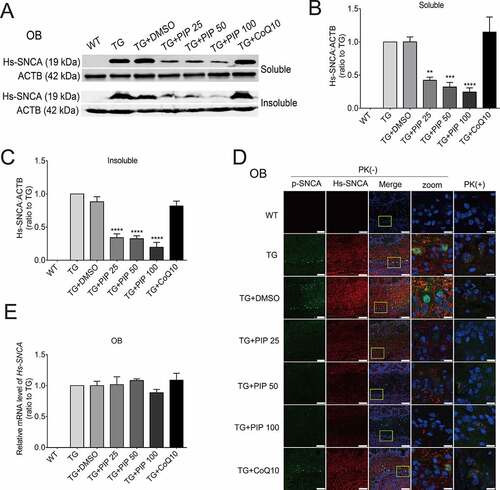
Figure 4. PIP improves cell viability and reduces cytotoxicity by SNCA degradation. (A–D) Optimal PIP treatment concentration (A and B) and time (C and D) were determined in SK-N-SH cells by evaluating cell viability and cytotoxicity with the MTT and LDH assays, respectively. The normalized ratio for the con group was taken as 1. (E) Apoptotic SK-N-SH cells were identified by PI (red) and Hoechst (blue) staining. Scale bar: 50 µm. (F-G) Cell death rates (F) and SNCA-transfected neurons (G) were quantified in SK-N-SH cells. The normalized ratio for the con group was taken as 1. (H) Immunoblot results of Hs-SNCA level in SK-N-SH cells. (I) Quantitative analysis of Hs-SNCA level in SK-N-SH cells. ACTB was used as a loading control. The normalized ratio for the SNCA group was taken as 1. (J) Representative immunofluorescence images showing SK-N-SH cells transfected with pmCherry-N1 or pmCherry-N1-SNCA stained with the anti-phospho SNCA antibody. Scale bar: 10 µm. (K) Hs-SNCA mRNA expression after PIP treatment in SK-N-SH cells was assessed by RT-PCR. Data are expressed as means ± SD (one-way analysis of variance). #P < 0.05, ####P < 0.0001 vs. con; *P < 0.05, **P < 0.01, ****P < 0.0001 vs. SNCA (n = 3).
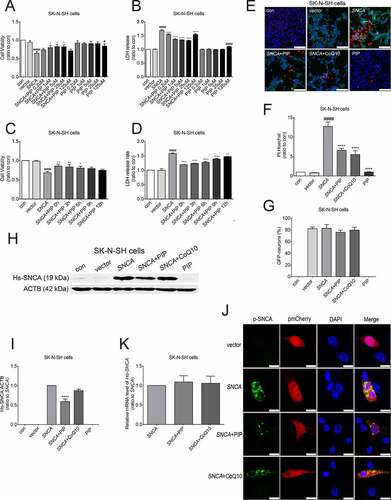
Figure 5. PIP promotes SNCA degradation via the ALP. (A) SK-N-SH cells were transfected with SNCA, and after 24 h, PIP was added at a concentration of 25 μM for 24 h. LC3-II and SQSTM1/p62 expression were elevated by western blotting in the presence of Rap (40 nM for 6 h) and BafA1 (100 nM for 6 h). (B–C) Quantitative analysis of LC3-II (B) and SQSTM1/p62 (C) levels in SK-N-SH cells. The normalized ratio for the con group was taken as 1. #P < 0.05, ####P < 0.0001 vs. con; *P < 0.05, **P < 0.01, ***P < 0.001, ****P < 0.0001 vs. SNCA. (D) SK-N-SH cells were transfected with SNCA, and after 24 h, PIP was added at a concentration of 25 μM for 24 h. Hs-SNCA expression was elevated as shown by western blotting in the presence of BafA1 (100 nM for 6 h). (E) Quantitative analysis of Hs-SNCA level in SK-N-SH cells. The normalized ratio for the SNCA+BafA1 group was taken as 1. Data are expressed as the means ± SD (one-way analysis of variance; n = 3). (F) Autophagy flux was evaluated by counting autophagosome (RFP-GFP double positive puncta) and autolysosomes (RFP-single positive puncta) using mRFP-GFP-LC3 primary neurons. Scale bar: 10 µm. (G) The mean number of RFP and GFP dots were determined manually (n = 10 cells). Data are expressed as the means ± SD (one-way analysis of variance; n = 3).
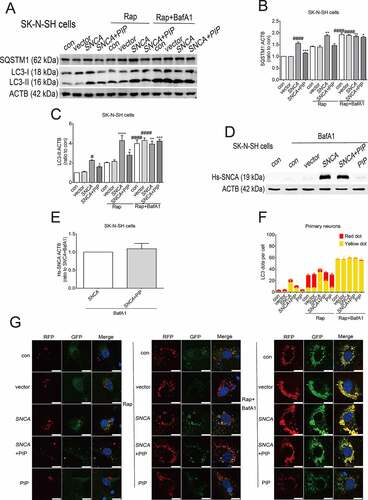
Figure 6. TMT quantitative proteomic experiments show P2RX4 as an effective target for PIP-induced SNCA autophagic degradation. (A) Differential protein quantitative results of the mouse OB proteome in 6-months-old TG mice before and after 100 mg/kg PIP treatment compared to age-matched WT mice. P < 0.05. (B) Kyoto Encyclopedia of Genes and Genomes (KEGG) analysis shows that the ALP may be a potential target for PIP treatment. (C) TMT quantitative proteomic shows that P2RX4 is upregulated after PIP treatment in OB. (D) Western blotting validated the change in P2RX4. (E) Quantitative analysis of P2RX4 level in OB. The normalized ratio for the WT group was taken as 1. (F) Representative immunofluorescence images showing the colocalization of P2RX4 and LAMP1 (lysosome marker) from mice slices of OB. Scale bar: 10 µm. Data are expressed as means ± SD (one-way analysis of variance). #P < 0.05 vs. WT; *P < 0.05 vs. TG (n = 3).
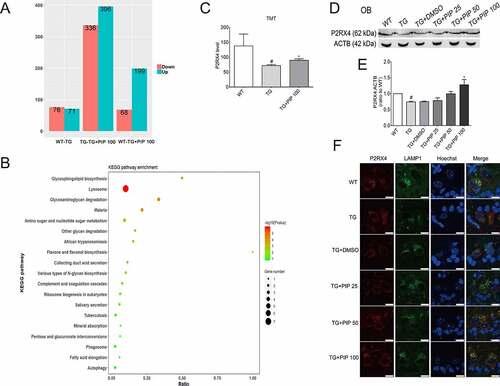
Figure 7. PIP promotes SNCA autophagic degradation via P2RX4 activation. SK-N-SH cells were transfected with SNCA, and after 24 h, PIP was added at a concentration of 25 μM for 24 h. IVE (a positive allosteric effector of P2RX4; 10 μM for 24 h) served as a positive control, while 5-BDBD (a potent P2RX4 receptor antagonist; 5 μM for 24 h) served as a negative control. (A) Hs-SNCA, p-SNCA, LC3-II and SQSTM1/p62 levels were elevated by western blotting. (B–C) Quantitative analysis of Hs-SNCA (B) and p-SNCA (C) levels in SK-N-SH cells. The normalized ratio for the SNCA group was taken as 1. (D–E) Quantitative analysis of LC3-II (D) and SQSTM1/p62 (E) levels in SK-N-SH cells. The normalized ratio for the con group was taken as 1. (F) Autophagy flux was evaluated by counting autophagosome (RFP-GFP double positive puncta) and autolysosomes (RFP-single positive puncta) in mRFP-GFP-LC3 primary neurons. Scale bar = 10 µm. (G) The mean number of RFP and GFP dots were determined manually (n = 10 cells). Data are expressed as means ± SD (one-way analysis of variance). ###P < 0.001, ####P < 0.0001 vs. con; *P < 0.05, **P < 0.01, ***P < 0.001, ****P < 0.0001 vs. SNCA; &P < 0.05, &&&P < 0.001, &&&&P < 0.0001 vs. SNCA+PIP (n = 3).
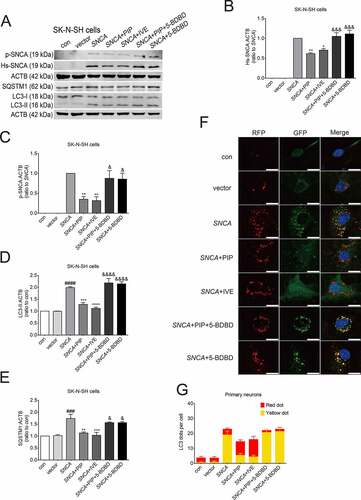
Figure 8. PIP promotes autophagic flux by enhancing autophagosome-lysosome fusion via P2RX4 activation. (A) STX17 level was elevated as shown by western blotting in SK-N-SH cells. (B) Quantitative analysis of STX17 level in SK-N-SH cells. The normalized ratio for the con group was taken as 1. Data are expressed as means ± SD (one-way analysis of variance). #P < 0.05 vs. con; *P < 0.05 vs. SNCA; &P < 0.05 vs. SNCA+PIP (n = 3). (C) LC3-II, SQSTM1/p62 and STX17 levels were elevated as shown by western blotting of OB. (D–F) Quantitative analysis of LC3-II (D), SQSTM1/p62 (E) and STX17 (F) levels in OB. ACTB was used as a loading control. The normalized ratio for the WT group was taken as 1. Data are expressed as means ± SD (one-way analysis of variance). #P < 0.05 vs. WT; *P < 0.05 vs. TG (n = 3).
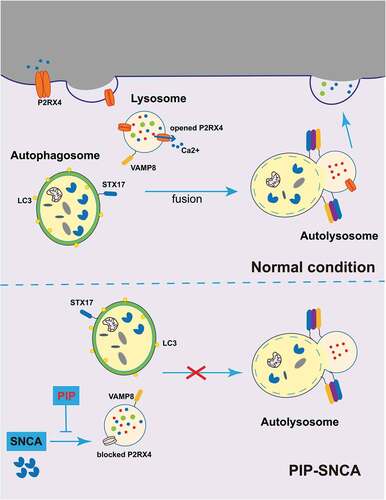
Figure 9. PIP exerts neuroprotective effects against SNCA-induced injury by activating P2RX4 and promoting autophagy flux. SNCA inhibits autophagy flux by inhibiting STX17, which drives autophagosome-lysosome membrane fusion via P2RX4 inactivation. PIP restores P2RX4 activity and promotes autophagy flux, which resulted in pathological SNCA autophagic degradation. PIP: piperine.