Figures & data
Figure 1. Autophagic activation during nitrogen starvation and appressorial formation. (A) Accumulation of the RFP-MrAtg8 signal in vacuoles upon nitrogen starvation. The fused gene was controlled by the MrATG8 gene promoter. Relative to the growth in the nutrient-rich SDB medium for 16 h (upper panels), vacuole formation (stained with the CMAC dye) and localization of RFP-MrAtg8 signals were induced in an MM-N medium for 4 h. Bar: 5 μm. (B) TEM analysis showing the formation of autophagic bodies (arrowed) upon nitrogen starvation. Relative to the growth in the nutrient-rich SDB medium (upper panel), autophagic bodies were formed in vacuole when the fungus was grown in an MM-N medium. LD, lipid droplet. Bar: 0.5 μm. (C) Accumulation of the RFP-MrAtg8 signal in appressorium vacuoles. After induction on a hydrophobic surface for 20 h, expression of RFP-MrAtg8 was controlled by either the MrATG8 promoter (Self-Pro) or a constitutive HSP70 promoter (pHSP70) of M. robertsii. Vacuoles were stained with the specific dye CMAC. Bar: 5 μm. (D) RFP expression in appressorium controlled by the HSP70 prpmoter. Inset shows the bright field image. Bar: 5 μm. (E) TEM analysis showing the formation of autophagic bodies (arrowed) in appressorial vacuoles. Appressoria were induced on the mealworm front wings for 18 h. AP, appressorium; PP, penetration peg. Bar: 0.5 μm.
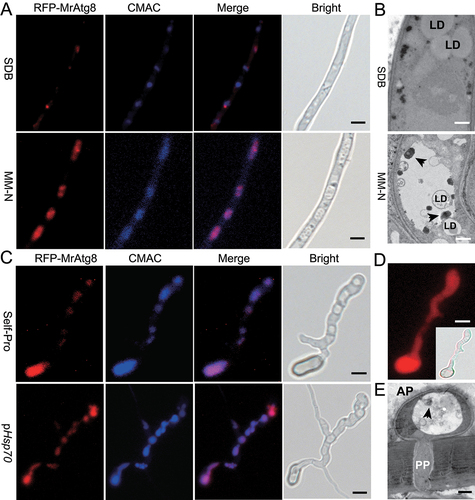
Table 1. Statistic estimation and comparison of the median lethal time (LT50) of the WT and mutant strains during topic infection of the wax moth larvae
Figure 2. Appressorial induction and fungal penetration assays. (A) Induction of appressorium formation on hydrophobic surfaces. The WT and virulence-related MrATG gene mutants were induced on Petri dishes for 20 h. (B) Induction of appressorium formation on cicada wings. The WT and virulence-related MrATG gene mutants were induced on cicada wings for 18 h. The significance of difference between WT and individual mutant is at: *, P < 0.05; **, P < 0.01; ***, P < 0.001. (C) Penetration of cellophane membrane. Spore suspensions (2 μl of 1 × 10⁶ conidia/ml) were inoculated on cellophane for four days, removed and the plates were kept for incubation for another six days (upper panels) or on membranes for seven days, removed and the plates kept for incubation for another three days (lower panels). (D) Penetration of cicada wings. Spore suspensions were inoculated on cicada wings for two days, removed and the plates were kept for incubation for another six days (upper panels) or on wings for four days, removed and the plates kept for incubation for another four days (lower panels).
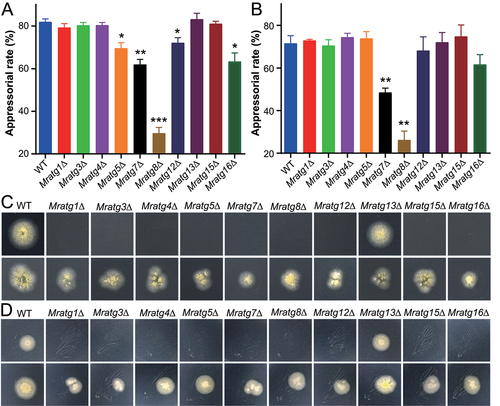
Figure 3. Lipid droplet degradation and accumulation. (A) Time-scale monitoring of LD degradation and formation of the RFP-MrAtg8 signal in appressorial cells. The co-transformant spores were induced on a hydrophobic surface for different times. Bar: 5 µm. (B) Monitoring of the LD distribution and RFP-MrAtg8 signal in mycelia harvested from different conditions. The co-transformed strain was grown in SDB for two days, harvested and washed prior to the inoculation in MM-N for 16 h. Bar: 5 μm. (C) LD accumulation within the WT and mutant conidia. Conidia of the WT and virulence-related mutants were harvested from the two-week-old CM plates and stained with the specific dye Bodipy. Bar: 5 μm.
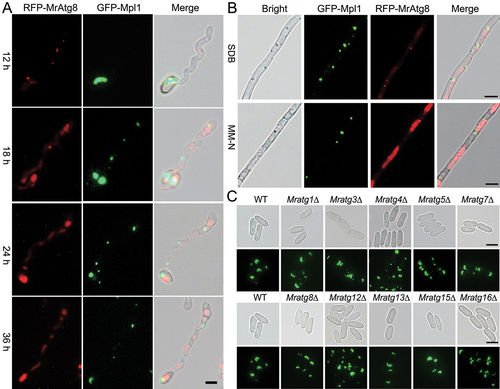
Figure 4. Features of protein expression and degradation in different strains. (A) Comparison of the LD-specific protein Mpl1 accumulation in conidia. Conidia of the WT and mutants were harvested from two-week-old CM plates and homogenized for western blot analysis. (B) Analysis of Mpl1 protein between strains after nitrogen starvation. The anti-Mpl1 antibody was used for blotting. (C) Analysis of MrAtg8 protein between WT and mutants after nitrogen starvation. The anti-Atg8 antibody was used for blotting. (D) Analysis of GFP-MrAtg8 degradation in the WT and mutant mycelial cells after nitrogen starvation. The anti-GFP antibody was used for blotting. For each analysis, the parallel-running protein gels were stained as references.
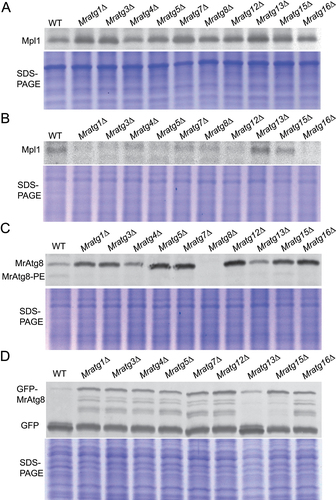
Figure 5. Variation in LD accumulation and degradation between strains. (A) TEM analysis of the vacuolar localization features of LDs in the WT and mutant mycelial cells after nitrogen starvation. The autophagic bodies are arrowed in the WT cell. Bar: 0.5 μm. (B) TEM featuring of the LDs outside the vacuoles of the WT and mutant mycelial cells after nitrogen starvation. Bar: 2 μm. (C) Quantification and comparison of the cellular TAG content between WT and mutants after nitrogen starvation. (D) Quantification and comparison of the cellular glycerol level between WT and mutants after nitrogen starvation. Fungal spores were inoculated in SDB for two days and transferred to the MM-N medium for 16 h. The significance of difference between WT and individual mutant is at: *, P < 0.05; **, P < 0.01; ***, P < 0.001.
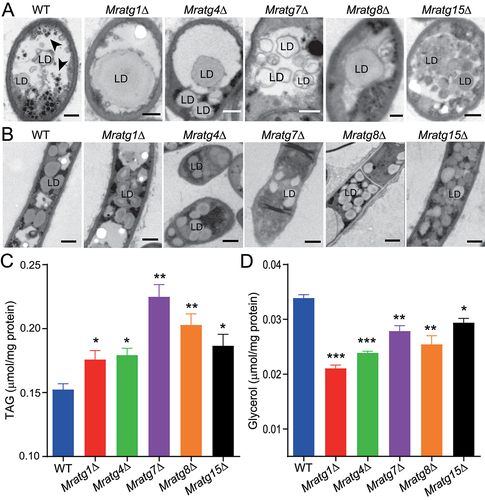
Figure 6. Monitoring of the RFP-MrAtg8 signal within the appressoria of different mutants. Fungal conidia harvested from the two-week-old CM plates were used for appressorium induction on a hydrophobic surface for 20 h. Bar: 5 μm.
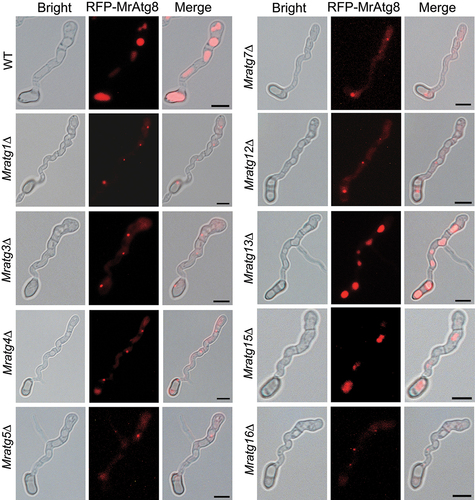
Figure 7. Protein interaction and colocalization assays. (A) Positive and negative interactions between MrAtg8 and other virulence-related proteins by yeast two-hybrid analysis. (B) Non-interaction between the perilipin Mpl1 and MrAtg8 or MrAtg15. (C) Colocalization of RFP-MrAtg8 and MrAtg15-GFP in vacuoles. Appressoria were induced on a hydrophobic surface. Nitrogen starvation was treated in MM-N medium for 4 h after spore germination in SDB for 16 h. Bright/CMAC means the overlap of the bright-field image with the CMAC-stained image for vacuoles. CO, conidium; AP, appressorium. Bar: 5 μm. (D) Location of MrAtg15-GFP in the vacuoles of the Mratg8∆ cell. The mutant spores were induced on a hydrophobic surface for 20 h. CO, conidium; Bar: 5 μm.
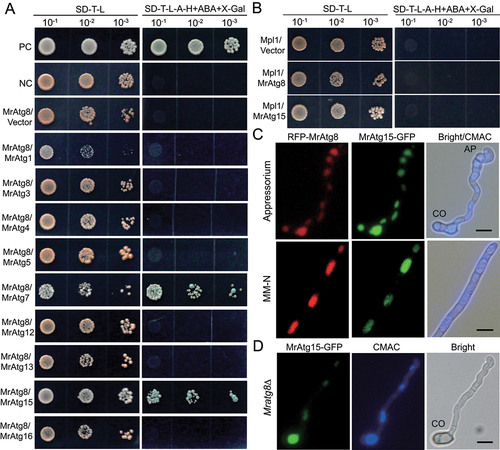
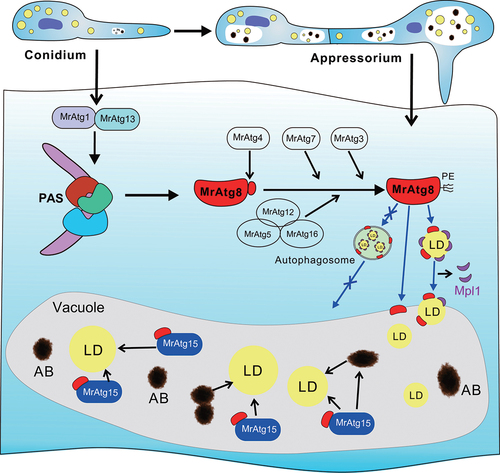
Figure 8. Schematic representation of the activation of microlipophagy in the appressorial cells of M. robertsii. The virulence-related autophagy components identified in this study are listed that may alternatively contribute to the activation of cell autophagy, lipidation of MrAtg8 and LD degradation. The autophagosome-mediated transfer of LDs into vacuoles may not occur based on the observations in this study, thus the employment of microlipophagic machinery to facilitate fungal early infection. PAS, phagophore assembly site; PE, phosphatidylethanolamine; AB, autophagic body.