Figures & data
Figure 1. Anti-CD38 mAb clone 90 drives CD38 internalization and TFEB nuclear translocation via NAADP-driven calcium signaling. (A) Immunoblot of endogenous TFEB after nuclear fractionation of WT B-lymphocytes treated with 10 µg/ml anti-CD38 antibody (clone 90) or an isotype control (Iso) for 1 h. (B) Quantification of nuclear TFEB normalized to histone H3 from (A) (n = 3). (C) Immunoblot of endogenous TFEB after nuclear fractionation of WT BMDMs treated with 5 µg/ml (+) or 10 µg/ml (++) anti-CD38 antibody (clone 90) for 1 h. (D) Quantification of nuclear TFEB normalized to histone H3 from (C) (n = 4). (E) Confocal imaging of WT BMDMs treated with 10 µg/ml anti-CD38 for 1 h and stained for TFEB (red) and CD38 (clone 90, green). Scale bar: 70 µm, 30 µm (zoom). (F) Confocal imaging of HEK293T cells transfected with HA-CD38 stimulated with anti-CD38 antibody (clone 90-Alexa Fluor 647, red) at either 4°C or 37°C for 30 min and subsequently stained for HA (green). Scale bar: 10 µm. (G) CD38 internalization after stimulation with anti-CD38 (clone 90) or an isotype control (10 µg/ml) (n = 2). (H) Confocal imaging of WT BMDMs following stimulation with anti-CD38 (clone 90, 10 µg/ml), an isotype control, or starvation. Quantification of nuclear:cytosolic mean fluorescence intensity (MFI) for each condition is shown (n ≥ 20 cells per condition). Scale bar: 20 µm. (I) Confocal imaging of WT BMDMs following stimulation with anti-CD38 (clone 90, 10 µg/ml) after preincubation with the indicated inhibitor. Quantification of nuclear:cytosolic mean fluorescence intensity (MFI) for each condition is shown (n ≥ 150 cells per condition). Scale bar: 30 µm. (J) Intracellular calcium response of WT B-lymphocytes stimulated with isotype control (10 µg/ml, blue) or anti-CD38 (clone 90 10 µg/ml, black) antibody with or without preincubation with Ned-19 (100 µM, green) or Gly-Phe-β-naphtylamide (GPN 200 µM, red). (K) Quantification of calcium responses (area under curve) to 5 min after stimulation with anti-CD38 (clone 90) and preincubation with Ned-19 (100 µM), 8-Br-ADPR (100 µM), 8-Br-cADPR (100 µM), GPN (200 µM), or EDTA (2 mM) (n = 3). Calcium response curve is shown to 5 min as fluorescent counts (iLm1). For western data, histone H3 and GAPDH are shown as fractionation controls. Western bands are quantified, normalized to the loading control, then presented relative to the control. (*p < 0.05; **p < 0.002, ***p < 0.0001, Student’s t-test or one-way ANOVA with post hoc Tukey’s HSD).
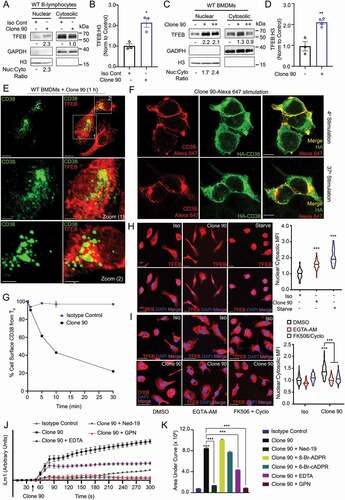
Figure 2. CD38 calcium signaling and nuclear localization of TFEB is dependent on LRRK2. Immunoblot of endogenous TFEB after nuclear fractionation of WT and lrrk2 KO (A) B-lymphocytes and (B) BMDMs treated with 5 µg/ml anti-CD38 antibody (clone 90) or an isotype control (Iso) for 1 h. (C) Quantification of western blots from A (upper, n = 4) and B (lower, n = 3). (D) Intracellular calcium response of purified WT (black) and lrrk2 KO (red) B-lymphocytes stimulated with anti-CD38 (clone 90, 5 and 10 µg/ml) antibody. (E) Quantification of calcium response (area under curve) from (D) to 5 min (n = 4). (F) Intracellular calcium response of purified WT (black) and LRRK2G2019S KI (blue) B-lymphocytes stimulated with anti-CD38 (clone 90, 5 and 10 µg/ml) antibody. (G) Quantification of calcium response from (F) to 5 min (n = 4). (H) Intracellular calcium response of purified WT (solid lines) or LRRK2G2019S KI (dashed lines) B-lymphocytes stimulated with anti-CD38 (clone 90 10 µg/ml, black) antibody with or without Ned-19 (100 µM, blue) or Gly-Phe-β-naphthylamide (200 µM, green). (I) Quantification of calcium responses (area under curve) from (H) to 5 min (n = 4). (J) Purified wild type (WT, black) or lrrk2 KO (KO, red) B-lymphocytes stimulated with NAADP-AM (3 µM). (K) Quantification of calcium responses (area under curve) from (H) to 5 min (n = 6). Partial calcium response curve is shown (to 3 min) as fluorescent counts (iLm1). For western data, histone H3 and GAPDH are shown as fractionation and loading controls. Western bands are quantified, normalized to the loading control, and presented relative to the control lane. (# – not significant; *p < 0.05; **p < 0.002, ***p < 0.0001, Student’s t-test or one-way ANOVA with post hoc Tukey’s HSD or Fisher’s LSD).
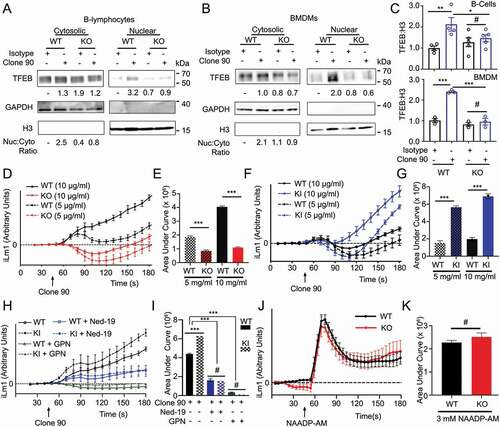
Figure 3. Clone 90 ligation targets CD38 to the endolysosomal system independently of LRRK2. (A) Confocal imaging analysis in WT and lrrk2 KO BMDMs to directly visualize colocalization between CD38 (tagged with clone 90-Alexa Fluor 647, red) in the absence of signaling (4°C) and after initiation of signaling for 30 min (37°C) with co-staining of LAMP1 (green). Colocalization channel is shown in gray pseudocolor. (B) Manders’ coefficient illustrating percent of CD38 colocalizing with LAMP1 (n ≥ 10). (C) Confocal imaging analysis in WT and lrrk2 KO BMDMs to directly visualize colocalization between CD38-Alexa Fluor 647 (red) 30 min after initiation of signaling with co-staining of RAB7 after cell fixation (green). (D) Manders’ coefficient illustrating percent of CD38 colocalizing with RAB7 (n ≥ 10). (# – not significant; *p < 0.05; **p < 0.002, ***p < 0.0001, Student’s t-test or one-way ANOVA with post hoc Tukey’s HSD).
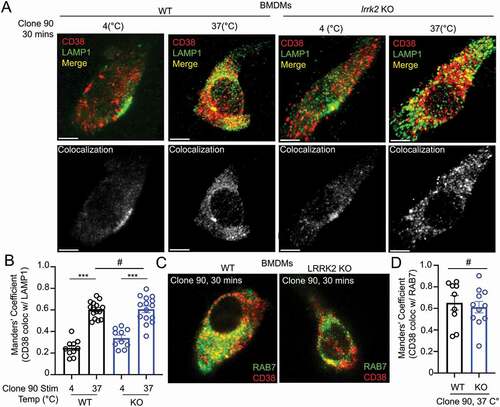
Figure 4. CD38 and LRRK2 interact after CD38 activation. (A) Co-immunoprecipitation of endogenous CD38 and LRRK2 in purified wild type B-lymphocytes following pulldown of anti-CD38 (clone 90, 10 µg/ml)-CD38 complexes using protein G affinity isolation after stimulation for the indicated time. (B) Schematic of LRRK2 constructs used in mapping the CD38-LRRK2 interaction (LRR: Leucine-rich repeat, ROC: Ras of complex, COR: C-terminal of ROC). (C and D) Domain mapping of the interaction between CD38 and LRRK2 using the indicated constructs. (E) Fluorescence resonance electron transfer fluorescence lifetime imaging (FRET-FLIM) of HEK293T cells transfected with MYC-LRRK2 with or without HA-CD38 imaged unstimulated or after anti-CD38 (clone 90, 10 µg/ml) stimulation for 30 min. Top panel shows fluorescence intensity of MYC-LRRK2-594, while bottom panels depict fluorescence lifetime with MYC-LRRK2-594 functioning as the donor and clone 90-Alexa Fluor 647 as the acceptor. White arrows indicate areas of CD38-LRRK2 interaction. Scale bar: 10 μm, 3.75 μm (zoom). (F) Quantification of the average fluorescence lifetime of MYC-LRRK2-594 (n = 15). (G) Calculated FRET efficiency in the unstimulated or clone-90 stimulated state. (H) Immunoblotting of the indicated proteins after stimulation with anti-CD38 (clone 90, 10 µg/ml) for the indicated time. ACTB/β-Actin is shown as a loading control. (# – not significant, *p < 0.05; **p < 0.002, ***p < 0.0001, Student’s t-test or one-way ANOVA with post hoc Tukey’s HSD).
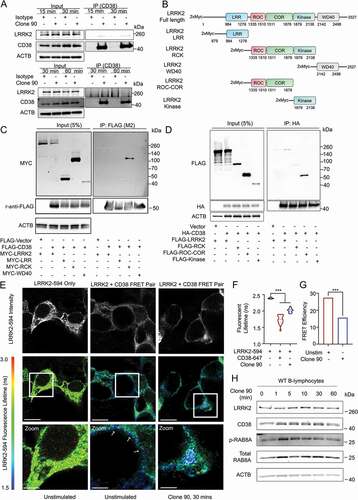
Figure 5. Overexpression of LRRK2 activates TFEB by promoting its stabilization and nuclear translocation. (A) Confocal imaging of HeLa cells expressing TFEB-mCherry and either GFP vector or GFP-LRRK2G2019S. Treatment with the GSK3B inhibitor CHIR99201 is shown as a positive control. Nuclei are stained with DAPI (blue). Scale bar: 20 µm. (B) Quantification of % of cells exhibiting TFEB nuclear translocation after co-transfection of TFEB-mCherry, GFP-LRRK2 WT and GFP-LRRK2G2019S (GS) in (A) (n = 4, ≥ 50 cells/repeat). (C) Immunoblot of endogenous TFEB after nuclear fractionation of HEK293T cells expressing LRRK2 WT and LRRK2G2019S (GS). (D) Quantification of (C) in HEK293T cells (n = 3). (E) Immunoblotting illustrating phospho-shift (indicated by arrow) of overexpressed TFEB-FLAG or TFEBΔCT-FLAG (TFEB*, aa 1–461) in HEK293T cells co-transfected with a control vector, His-LRRK2G2019S (GS), or GFP-LRRK2G2019S (GS^). (F) Quantification of (E). Bands were normalized to the control group for each TFEB construct (n ≥ 3). Western bands are quantified, normalized to the loading control, and presented relative to the control lane. (# – not significant, *p < 0.05; **p < 0.002, ***p < 0.0001, one-way ANOVA with post hoc Tukey’s HSD).
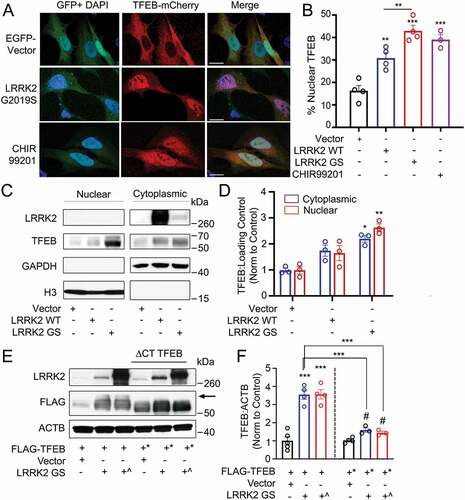
Figure 6. AMPK is required for the LRRK2-induced transcription of TFEB target genes. (A) Immunoblotting of the indicated TFEB target proteins in HEK293T cells after transfection of a control vector or His-LRRK2G2019S (GS). (B) Quantification of immunoblots from (A) (n ≥ 4). (C) q-RT-PCR in HEK293T cells transfected with a control vector or His-LRRK2G2019S (GS) (n ≥ 3). (D) q-RT-PCR of TFEB target genes in HEK293T cells transfected with His-LRRK2G2019S with or without dorsomorphin (5 μM, 1 h) pretreatment (n ≥ 3). (E) q-RT-PCR of TFEB target genes in HEK293T cells transfected with His-LRRK2G2019S and either control siRNA or siRNA targeting PRKAA1 and PRKAA2 (n = 4). Fold mRNA change is normalized to GAPDH and shown relative to the control. (*p < 0.05; **p < 0.002, ***p < 0.0001, Student’s t-test or one-way ANOVA with post hoc Tukey’s HSD).
Figure 7. LRRK2G2019S-mediated TFEB nuclear translocation requires Ca2+, NAADP, and TPCN2 (A) Confocal imaging in HeLa cells expressing TFEB-mCherry and a control vector (MT) or His-LRRK2G2019S with or without BAPTA-AM (fast calcium chelator, 10 μM, 1 h), EGTA-AM (slow calcium chelator, 10 μM, 1 h), FK506 (calcineurin inhibitor, 5 nM, 1 h), control siRNA, PPP3CB siRNA, or MCOLN1 siRNA. Scale bar: 10 μm. (B) Quantification TFEB nuclear translocation from (A) (n = 3, ≥ 50 cells/repeat). (C) Confocal imaging in HeLa cells expressing TFEB-mCherry and a control vector (MT), or TFEB-mCherry and His-LRRK2G2019S with or without Ned-19 (NAADP inhibitor, 100 μM, 1 h), PERK inhibitor (PERK-I, 10 μM, 1 h), control siRNA, or TPCN2 siRNA. Scale bar: 10 μm. (D) Quantification of TFEB nuclear translocation from (C) (n = 3, ≥ 50 cells/repeat). (E) Immunoblot of endogenous TFEB from nuclear fractions of HEK293T cells transfected with a control vector or His-LRRK2G2019S (GS) and either control siRNA or PPP3CB siRNA (PPP3CB KD). (F) Immunoblot of endogenous TFEB from nuclear fractions in HEK293T cells transfected with a control vector or His-LRRK2G2019S (GS) and treated with Ned-19 (100 μm, 2 h). (G) Confocal imaging in HeLa cells transfected with TFEB-mCherry and TPC2-EGFP. DAPI and TFEB-mCherry colocalization channel is shown on the right. Scale bar: 10 μm. (H) Quantification of % cells exhibiting TFEB nuclear translocation from (G) (n = 3, ≥ 50 cells/repeat). (I) Immunoblotting of endogenous TFEB following nuclear fractionation of HEK293T cells expressing TPCN2-EGFP. For western data, histone H3 and GAPDH are shown as fractionation and loading controls. Western bands are quantified, normalized to the loading control, and presented relative to control lane. (*p < 0.05; **p < 0.002, ***p < 0.0001, one-way ANOVA with post hoc Tukey’s HSD).
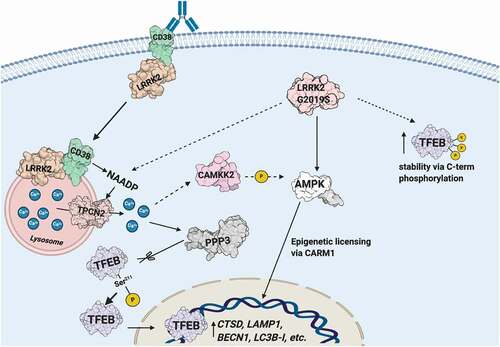
Figure 8. Schematic illustrating the CD38-LRRK2-TFEB signaling pathway in B-lymphocytes and macrophages. The CD38-LRRK2 complex exists on the plasma membrane and activation of CD38 results in the internalization of the CD38-LRRK2 complex and its targeting to the endolysosomal system. CD38 promotes generation of an NAADP-dependent lysosomal calcium signal, which is dependent on LRRK2 kinase activity. This results in the activation of PPP3/calcineurin, which dephosphorylates TFEB at Ser211 and allows its nuclear translocation. The pathogenic kinase overactive LRRK2G2019S mutant aberrantly activates TFEB via NAADP-TPCN2-dependent calcium signaling and stabilizes TFEB by promoting its C-terminal phosphorylation. Solid arrows indicate known relationships, while dashed arrows indicated hypothesized connections.