
Figures & data
Figure 1. PM exposure promotes lung pre-metastatic niche formation and lung metastasis. (A-C) Schematic illustration of the PM exposure (100 µg) time points and the establishment of lung metastatic tumors (A). Representative images (left) and quantitative analysis (right) of the lung metastasis of B16-F10 tumor cells in normal saline (NS)- or PM (100 µg)-treated mice, as detected by luciferase-based bioluminescence imaging (B). Representative lung appearance (left) and statistical analysis (right) of lung nodules in NS- or PM (100 µg)-treated mice bearing B16-F10 tumor cell lung metastases (C). (D-E) Schematic illustration of the establishment of 4T1 spontaneous lung metastatic models and the PM exposure (100 µg) timepoints (D). H&E-stained lung sections (left) and quantification (right) of the lung metastatic burden in NS- or PM (100 µg)-treated mice bearing 4T1 tumor lung metastases. Scale bar: 50 µm (E). (F-G) Quantitative PCR analysis of pro-metastatic genes (F), representative images of ACTA2/α-SMA-stained lung sections (left) and quantitative analysis of ACTA2/α-SMA expression levels (right) (G) in the lungs of mice after 5 exposures to PM (100 µg) over 10 days. Scale bars: 100 μm. The error bars indicate the mean ± SD values (n = 3). *P < 0.05; **P < 0.01; ***P < 0.001 (unpaired Student’s t test). The data are one representative experiment of three independent experiments. Each independent experiment had three samples (n = 3) per group, and each dot represents one sample.
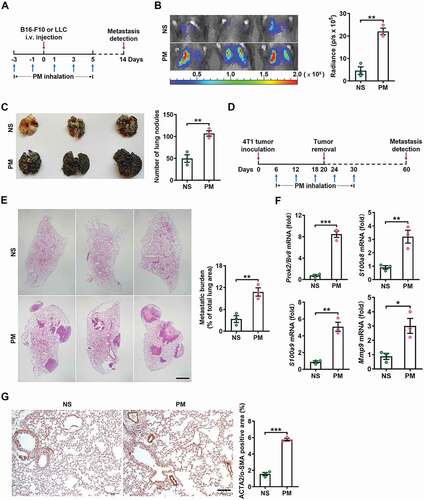
Figure 2. PM promotes lung metastasis via a neutrophil-dependent mechanism. (A) The frequency of neutrophils and macrophages in the lungs of C57BL/6 mice was examined by flow cytometry after NS or PM (100 µg) exposure for 24 h. (B) Immunofluorescence staining (left) and quantitative analysis (right) of LY6G+ neutrophils in the lungs of NS- or PM (100 µg)-treated mice. Scale bar: 100 μm. (C) The gene expression levels of Cxcl1, Cxcl2, Cxcl5, Cxcl8, Ccl3 and Cxcl12 in the lung tissues of mice exposed to PM (100 µg) for 12 h were analyzed by quantitative PCR. (D) The protein expression levels of CXCL2 and IL8 in the BALF of mice exposed to PM (100 µg) were analyzed by ELISA. (E) The gene expression levels of Cxcl1, Cxcl2 and Cxcl5 and the frequency of neutrophils in lung tissues after PM (100 µg) exposure for the indicated durations were analyzed by quantitative PCR and flow cytometry. (F) The protein expression levels of VEGF in lung tissues were measured by ELISA. (G) Immunofluorescence analysis of the presence of extravasated dextran in lung tissues after NS or PM (100 µg) exposure. Scale bars: 100 μm. (H) The frequency of neutrophils in the lungs of mice after NS or PM (100 µg) exposure and anti-KDR/VEGFR-2 treatment was determined by flow cytometry. (I) Bioluminescent images (left) and quantitative analysis (right) of B16-F10 cell lung metastasis in mice after NS or PM (100 µg) exposure and neutrophil depletion with anti-GSR/Gr1. The error bars indicate the mean ± SD values (n = 3). A, B, C, D and F *P < 0.05; **P < 0.01; ***P < 0.001; n.s., not significant (unpaired Student’s t test). E, H and I *P < 0.05; **P < 0.01; ***P < 0.001; n.s., not significant (one-way ANOVA test). The data are one representative experiment of three independent experiments. Each independent experiment had three samples (n = 3) per group, and each dot represents one sample.
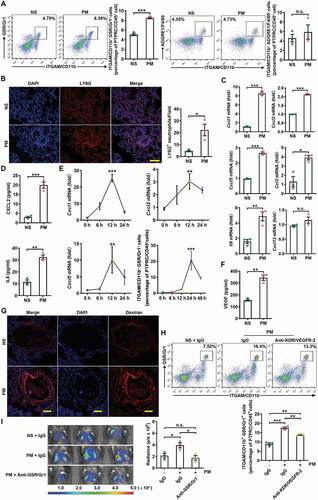
Figure 3. PM-induced lung metastasis is dependent on autophagy. (A) Expression of GFP-LC3 and EPCAM and the numbers of GFP puncta in the lungs of mice exposed to NS or PM (100 µg) for 24 h. Scale bars: 100 μm. (B) The frequency of neutrophils in the lungs of lc3b-/- mice and their wild-type (WT) littermates after PM (100 µg) exposure was examined by flow cytometry. (C) Bioluminescent images (left) and quantitative analysis (right) of B16-F10 cell lung metastasis in lc3b-/- mice and their WT littermates after NS or PM (100 µg) exposure. (D) Quantitative PCR analysis of pro-metastatic genes in the lungs of NS- or PM (100 µg)-treated lc3b-/- mice or their WT littermates. (E) The protein expression levels of CXCL2 and IL8 in BALF of Sftpc-CreER × Atg5fl/fl mice and Sftpc-CreER mice after exposure to PM (100 µg) were analyzed by ELISA. (F) The frequency of neutrophils in the lungs of Sftpc-CreER × Atg5fl/fl mice and Sftpc-CreER mice after PM (100 µg) exposure was examined by flow cytometry. (G) Bioluminescent images (top) and quantitative analysis (bottom) of B16-F10 cell lung metastasis in Sftpc-CreER × Atg5fl/fl mice and Sftpc-CreER mice after NS or PM (100 µg) exposure. (H) Bioluminescent images (left) and quantitative analysis (right) of B16-F10 cell lung metastasis in NS- or PM (100 µg)-exposed mice with or without HCQ (60 mg kg−1) treatment. The error bars indicate the mean ± SD values (n = 3). A **P < 0.01 (unpaired Student’s t test). B to H *P < 0.05; **P < 0.01; ***P < 0.001; n.s., not significant (two-way ANOVA test). The data are one representative experiment of three independent experiments. Each independent experiment had three samples (n = 3) per group, and each dot represents one sample.
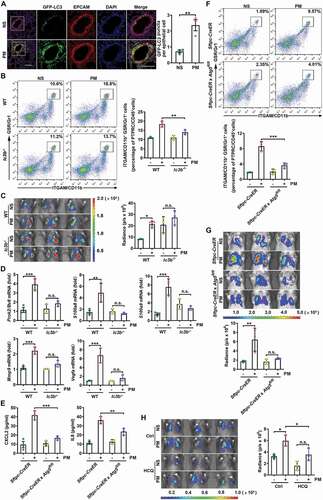
Figure 4. PM-induced ROS are responsible for enhanced autophagy and lung metastasis. (A) GFP-LC3 expression and the numbers of GFP puncta in the airway epithelial cells of mice exposed to NS or PM (100 µg) with or without NAC (275 mg kg−1) treatment for 24 h. Scale bar: 100 μm. (B) The frequency of neutrophils in the lungs of NS- or PM (100 µg)-exposed mice with or without NAC (275 mg kg−1) treatment was examined by flow cytometry. (C) Bioluminescent images (top) and quantitative analysis (bottom) of B16-F10 cell lung metastasis in NS- or PM (100 µg)-exposed mice with or without NAC (275 mg kg−1) treatment. (D) Bioluminescent images (top) and quantitative analysis (bottom) of B16-F10 cell lung metastasis in PM (100 µg)-exposed lc3b−/- mice with or without NAC (275 mg kg−1) treatment. The error bars indicate the mean ± SD values (n = 3 or 4). A *P < 0.05; **P < 0.01 (one-way ANOVA test). B and C ***P < 0.001; n.s., not significant (two-way ANOVA test). D n.s., not significant (unpaired Student’s t test). The data are one representative experiment of three independent experiments. Each independent experiment had three or four samples (n = 3 or 4) per group, and each dot represents one sample.
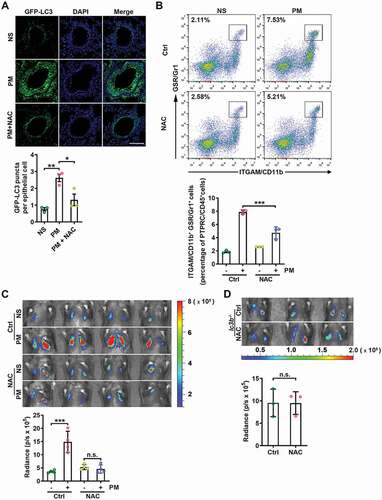
Figure 5. PM-induced TRAF6 accumulation contributes to lung metastasis by activating the NFKB pathway. (A) Western blot analysis of the indicated proteins in HBE cells exposed to NS or PM (100 μg/ml) for the indicated times. (B) The protein expression levels of CXCL2 and IL8 in the culture supernatants of HBE cells exposed to PM (100 μg/ml) and treated with the indicated inhibitor (MAPK/JNK inhibitor, SP600125, 10 μM; MAPK/ERK inhibitor, U0126, 10 μM; MAPK/p38 inhibitor, SB203580, 10 μM or NFKB (RELA/p65) inhibitor, BAY11-7082, 10 μM) were analyzed by ELISA. (C) Western blot analysis of TRAF6 and TRAF2 in HBE cells exposed to NS or PM (100 μg/ml) for the indicated times. (D) Representative immunofluorescence images of TRAF6 expression in HBE cells treated with NS or PM (100 μg/ml) for 24 h. (E) The protein expression levels of CXCL2 and IL8 in the culture supernatants of HBE cells exposed to PM (100 μg/ml) for 24 h after negative control (NC) siRNA or Traf6 siRNA transfection were analyzed by ELISA. (F) Images and quantitative analysis of TRAF6 expression in the lungs of mice exposed to NS or PM (100 μg) for 24 h. Scale bar: 100 μm. (G) Bioluminescent images (left) and quantitative analysis (right) of B16-F10 cell lung metastasis in Cho-Traf6 siRNA-treated mice with NS or PM (100 μg) exposure. The error bars indicate the mean ± SD values (n = 3). B andF **P < 0.01; ***P < 0.001; n.s., not significant (unpaired Student’s t test). E andG *P < 0.05; **P < 0.01 (two-way ANOVA test). The data are one representative experiment of three independent experiments. Each independent experiment had three samples (n = 3) per group, and each dot represents one sample.
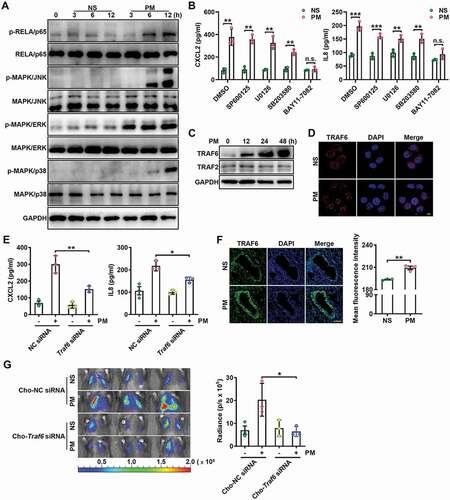
Figure 6. PM-induced autophagy prevents the proteasome-dependent degradation of TRAF6. (A) Western blot analysis of TRAF6 protein expression levels in HBE cells treated with PM (100 μg/ml) for 24 h with or without the proteasome inhibitor MG132 (10 μM) (top), and statistical analysis of the relative protein expression levels (bottom). (B) Western blot analysis of TRAF6 protein expression levels in HBE cells treated with PM (100 μg/ml) for 24 h with or without the lysosome inhibitor Baf A1 (10 nM) (top), and statistical analysis of the relative protein expression levels (bottom). (C) Western blot analysis of LC3B-I and LC3B-II levels in HBE cells treated with PM (100 μg/ml) for 24 h with or without MG132 (10 μM) (top), and statistical analysis of the relative protein expression levels (bottom). (D) Representative fluorescence images (top) and quantitative analysis of GFP+ and RFP+ puncta (bottom) in HBE cells transfected with mRFP-GFP-LC3-expressing vectors for 24 h and then treated with NS or PM (100 μg/ml) in the presence of MG132 (10 μM). Scale bar: 5 μm. The error bars indicate the mean ± SD values (n = 3). A to C *P < 0.05; **P < 0.01; ***P < 0.001; n.s., not significant (two-way ANOVA test). D *P < 0.05; **P < 0.01 (unpaired Student’s t test). The data are one representative experiment of three independent experiments. Each independent experiment had three samples (n = 3) per group, and each dot represents one sample.
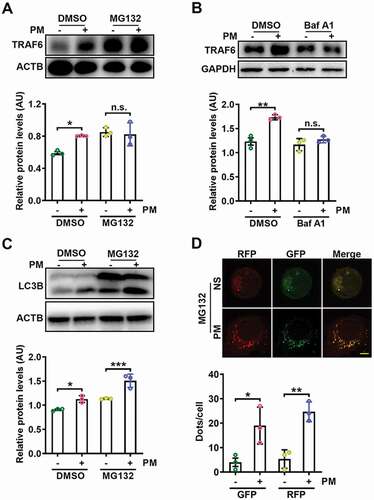
Figure 7. Autophagy-mediated TRIM37 degradation inhibits TRAF6 degradation via the ubiquitin-proteasome pathway. (A) Coimmunoprecipitation and western blot analysis of HEK293T cells co-transfected with Flag-TRAF6 and HIS-TRIM37, stimulated with increasing concentrations of PM (25, 50, 100 and 200 μg/ml) for 12 h, and treated with MG132 (10 μM) for 6 h before harvest. (B) Representative fluorescence images of the colocalization of TRAF6 and TRIM37 in HBE cells treated with NS or PM (100 μg/ml) for 12 h in the presence of MG132 (10 μM). Scale bar: 5 μm. (C) Western blot analysis of the ubiquitination of TRAF6 in HEK293T cells co-transfected with Flag-TRAF6 and HA-K48-Ub or HA-K63-Ub with or without HIS-TRIM37 and treated with MG132 (10 μM) for 6 h before harvest. (D) Western blot analysis of TRAF6 proteins in HBE cells transfected with HIS-TRIM37 or the empty vector and treated with DMSO or MG132 (10 μM) for 6 h before harvest. (E-F) Western blot analysis of TRAF6 protein levels in HBE cells transfected with HIS-TRIM37 or the empty vector (E) or with NC siRNA or Trim37 siRNA (F) and then exposed to NS or PM (100 μg/ml) for 24 h. (G) Representative immunofluorescence images (left) and quantification of the colocalization (right) of LC3B and TRIM37 in HBE cells treated with NS or PM (100 μg/ml) for 12 h with or without Sqstm1 siRNA transfection in the presence of Baf A1 (10 nM). Scale bar: 5 μm. (H) Western blot analysis of TRIM37 and TRAF6 protein levels in HBE cells transfected with NC siRNA or Sqstm1 siRNA, and then exposed to NS or PM (100 μg/ml) for 24 h. (I) Western blot analysis of TRIM37 and TRAF6 protein levels in HBE cells transfected with NC siRNA or Atg3 siRNA and then exposed to NS or PM (100 μg/ml) for 24 h. The error bars indicate the mean ± SD values (n = 3). **P < 0.01; n.s., not significant (one-way ANOVA test). The data are one representative experiment of three independent experiments. Each independent experiment had three samples (n = 3) per group, and each dot represents one sample.
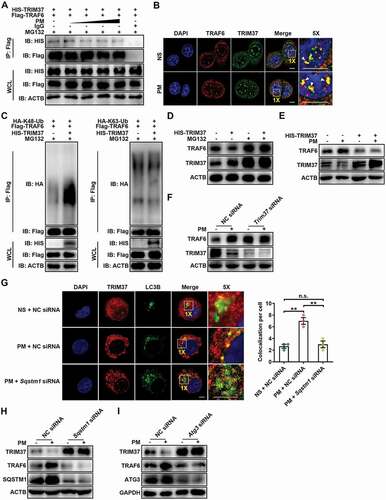
Figure 8. Working model of the mechanism by which PM controls lung metastasis. PM exposure triggers autophagy in the airway epithelium through increased ROS levels. The E3 ligase TRIM37 is sorted into autophagosomes via SQSTM1 in response to PM-induced autophagy. Autophagy-dependent TRIM37 degradation results in TRAF6 protein accumulation by inhibiting the K48-linked ubiquitination of TRAF6, thereby promoting NFKB pathway activation and inflammatory chemokine production. Finally, neutrophils are recruited to the lungs, thus fostering pre-metastatic niche formation in the lungs and lung metastasis.
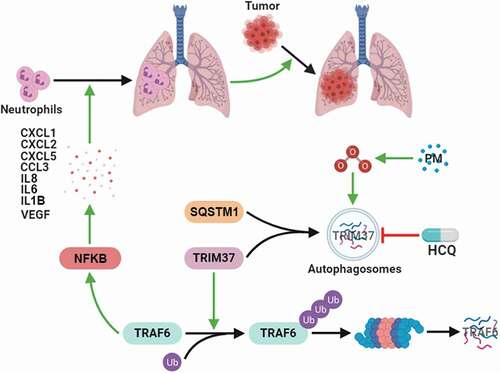
Table 1. Antibodies for flow cytometry, immunoblotting and immunofluorescence