
Figures & data
Figure 1. Starvation and AAD induce FAM134B2 through a pathway independent of CEBPs, EIF2AK4 and MTOR. (A, B) RETREG1 and FAM134B2 mRNA expression in HeLa cells treated with EBSS or complete DMEM (CM). (C) FAM134B2 protein expression in HeLa cells treated with EBSS. HeLa cells were treated with EBSS for 6 h. (D, E) RETREG1 and FAM134B2 mRNA expression in HeLa cells treated with leucine-deficient media. HeLa cells were treated with DMEM lacking Leucine for 6 h. (F, G) RETREG1 and FAM134B2 mRNA expression in HeLa cells treated with a Histidine antagonist, HisOH. (H) CEBP mRNA expression in HeLa cells treated with HisOH. HeLa cells were treated with DMEM containing 2 mM HisOH for 6 h. (I) CEBP mRNA expression in HeLa cells treated with CEBP RNAi. (J) FAM134B2 mRNA expression in HeLa cells treated with CEBP RNAi in the presence of HisOH. HeLa cells were treated with 10 nM RNAi in the presence of RNAi Max for 16 h and then treated with 2 mM HisOH for 6 h. (K–M) EIF2AK4, FAM134B2 and DDIT3 expression in HeLa cells treated with EIF2AK4 RNAi and HisOH. HeLa cells were treated with 10 nM RNAi in the presence of RNAi Max for 16 h and then treated with 2 mM HisOH for 6 h. (N, O) FAM134B2 and DDIT3 expression in HeLa cells treated with ISRIB and HisOH. HeLa cells were treated with 200 nM ISRIB for 2 h and then treated with 2 mM HisOH for 6 h. (P) Effect of MTOR on the mRNA expression of FAM134B2. HeLa cells were treated with MTOR inhibitors [rapamycin (Rapa), 100 nM and Torin 1, 1 μM] for 6 h. ***P < 0.001.
![Figure 1. Starvation and AAD induce FAM134B2 through a pathway independent of CEBPs, EIF2AK4 and MTOR. (A, B) RETREG1 and FAM134B2 mRNA expression in HeLa cells treated with EBSS or complete DMEM (CM). (C) FAM134B2 protein expression in HeLa cells treated with EBSS. HeLa cells were treated with EBSS for 6 h. (D, E) RETREG1 and FAM134B2 mRNA expression in HeLa cells treated with leucine-deficient media. HeLa cells were treated with DMEM lacking Leucine for 6 h. (F, G) RETREG1 and FAM134B2 mRNA expression in HeLa cells treated with a Histidine antagonist, HisOH. (H) CEBP mRNA expression in HeLa cells treated with HisOH. HeLa cells were treated with DMEM containing 2 mM HisOH for 6 h. (I) CEBP mRNA expression in HeLa cells treated with CEBP RNAi. (J) FAM134B2 mRNA expression in HeLa cells treated with CEBP RNAi in the presence of HisOH. HeLa cells were treated with 10 nM RNAi in the presence of RNAi Max for 16 h and then treated with 2 mM HisOH for 6 h. (K–M) EIF2AK4, FAM134B2 and DDIT3 expression in HeLa cells treated with EIF2AK4 RNAi and HisOH. HeLa cells were treated with 10 nM RNAi in the presence of RNAi Max for 16 h and then treated with 2 mM HisOH for 6 h. (N, O) FAM134B2 and DDIT3 expression in HeLa cells treated with ISRIB and HisOH. HeLa cells were treated with 200 nM ISRIB for 2 h and then treated with 2 mM HisOH for 6 h. (P) Effect of MTOR on the mRNA expression of FAM134B2. HeLa cells were treated with MTOR inhibitors [rapamycin (Rapa), 100 nM and Torin 1, 1 μM] for 6 h. ***P < 0.001.](/cms/asset/85ef9248-8ec5-47b3-a336-7aee3cc440af/kaup_a_1968228_f0001_b.gif)
Figure 2. Identification of transcription factors contributing to AAD-induced FAM134B2. (A) Transcription factors (TF) induced in HeLa cells treated with HisOH. HeLa cells (N = 3) were treated with DMEM containing 2 mM HisOH or without HisOH (Ctrl) for 6 h. Total RNA was subjected to RNA-seq (Table S2). (B) Effect of ISR inhibition on induced TF mRNA expression by HisOH. HeLa cells (N = 3) were treated with 200 nM ISRIB for 2 h and then treated with 2 mM HisOH for 6 h. (C) HisOH-induced TF mRNA expression in HeLa cells treated with EBSS, Leu-deficient DMEM or complete DMEM (CM). (D) TF mRNA expression in HeLa cells treated with RNAi. (E) FAM134B2 mRNA expression in HeLa cells treated with siRNAs. HeLa cells were treated with 10 nM RNAi in the presence of RNAi Max for 16 h and then treated with 2 mM HisOH for 6 h. *P < 0.05 vs. Scramble siRNA (Scr).
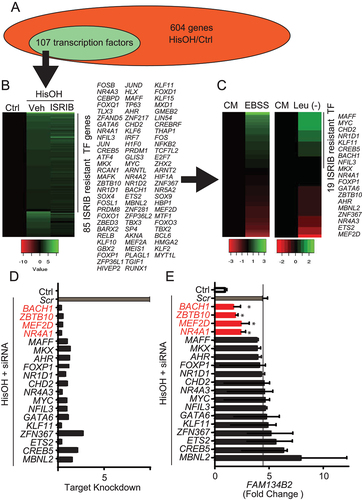
Figure 3. MEF2D-NR4A1 knockdowns reduces AAD-induced FAM134B2. (A) NR4A1, MEF2D, BACH1 and FAM134B2 protein expression in HeLa cells. HeLa cells were treated with siRNAs in the presence of 2 mM HisOH. HeLa cells were treated with 10 nM siRNA using RNAi Max reagent and then treated with complete DMEM containing 2 mM HisOH for 6 h. (B) FAM134B2, (C) MEF2D, (D) NR4A1, (E) BACH1 and (F) ZBTB10 mRNA expression in HeLa cells treated with siRNAs. HeLa cells were treated with siRNAs in the presence of 2 mM HisOH. HeLa cells were treated with 10 nM siRNA using RNAi Max reagent and then treated with complete DMEM containing 2 mM HisOH for 6 h. ***P < 0.001 vs. HeLa cells treated with scramble control siRNA in the presence of HisOH. ###P < 0.001 vs. HeLa cells treated with scramble control siRNA in the absence of HisOH.
Figure 4. Activation of the MEF2D-NR4A1 pathway induces FAM134B2 expression. (A) RETREG1, (B) FAM134B2, (C) MEF2D and (D) NR4A1 mRNA expression in HeLa cells overexpressing MEF2D, NR4A1, BACH1 or ZBTB10. HeLa cells were transfected with pcDNA3-MEF2D, -NR4A1, -BACH1 or -ZBTB10 for 16 h. mRNA RNA levels were analyzed with RT-qPCR analysis. (E) NR4A1 and (F) FAM134B2 mRNA in HeLa cells overexpressing MEF2D treated with NR4A1 siRNA. HeLa cells were treated with 10 nM NR4A1 siRNA using RNAi Max reagent for 24 h and then transfected with pcDNA3-NR4A1 for 16 h. (G) MEF2D and (H) FAM134B2 mRNA in HeLa cells overexpressing NR4A1 treated with MEF2D siRNA. HeLa cells were treated with 10 nM MEF2D siRNA using RNAi Max reagent for 24 h and then transfected with pcDNA3-MEF2D for 16 h. ***P < 0.001.
Figure 5. NR4A1 overexpression induces the FAM134B2-mediated ER-lysosomal degradation pathway. (A) Immunoblot analysis of FAM134B2 in NR4A1 overexpressed cells in the absence and presence of 200 nM bafilomycin A1 (Baf. A1) for 6 h. (B) Immunofluorescence of FAM134B2+RETREG1 (green), FLAG-NR4A1 (red), LAMP1 (magenta) and DAPI (blue) in control plasmid or FLAG-NR4A1 overexpressed HeLa cells treated with 200 nM bafilomycin A1 for 6 h. Scale indicates 10 μm in inset images. Inset indicates that NR4A1-induced FAM134B2 accumulated in LAMP1-positive lysosome. (C) Immunofluorescence of FAM134B2+RETREG1 (green), LAMP1 (magenta) and FLAG (blue) in mCherry-APOC3 (red) with control plasmid or FLAG-NR4A1 overexpressed HeLa cells treated with 200 nM bafilomycin A1 for 6 h. Scale: 10 μm, and 2 μm in inset images. Arrow indicates mCherry-APOC3 and RETREG1+FAM134B2-positive LAMP1. (D) Percentage of mCherry-APOC3 and RETREG1+FAM134B2-positive lysosomes in control vector or FLAG-NR4A1 expressed HeLa cells treated with bafilomycin A1 for 6 h (n = 13). *P < 0.05.
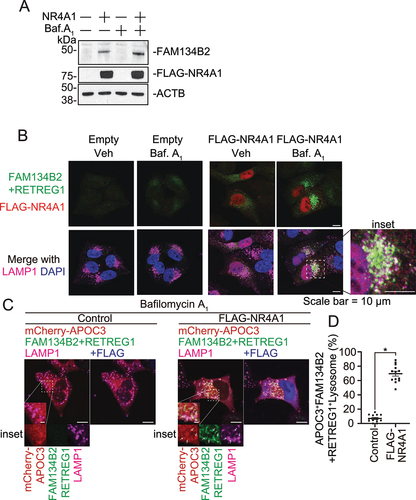
Figure 6. NR4A1 activates FAM134B2-mediated reticulophagy. (A) Immunofluorescence of FAM134B2 (green), LAMP1 (magenta) and FLAG (blue) in mCherry-APOC3 (red) with control plasmid or FLAG-NR4A1 (F-NR4A1) overexpressed HeLa FAM134B2 KO cells treated with 200 nM bafilomycin A1 for 6 h. Arrow indicates mCherry-APOC3 and FAM134B2+RETREG1-positive LAMP1. (B) Immunofluorescence of FAM134B2+RETREG1 (green), LAMP1 (magenta) and mTagBFP2-NR4A1 (blue) in mScarlet-RTN2 (red) with control plasmid or mTagBFP2-NR4A1 overexpressed HeLa FAM134B2-RETREG1 dKO cells treated with 200 nM bafilomycin A1 for 6 h. Arrow indicates mScarlet-RTN2 and FAM134B2+RETREG1-positive LAMP1. Scale: 10 μm, and 2 μm in inset images. Percentage of (C) mCherry-APOC3 and Lysosome double positive, (D) FAM134B2+RETREG1 and lysosome double positive, and (E) mCherry-APOC3-FAM134B2-lysosome triple positive in control vector or FLAG-NR4A1 expressed HeLa WT or FAM134B2 KO (B2 KO) cells treated with bafilomycin A1 for 6 h (n = 12). Quantifications of the RTN2 experiment are shown in Figure S3A–C. *P < 0.05.
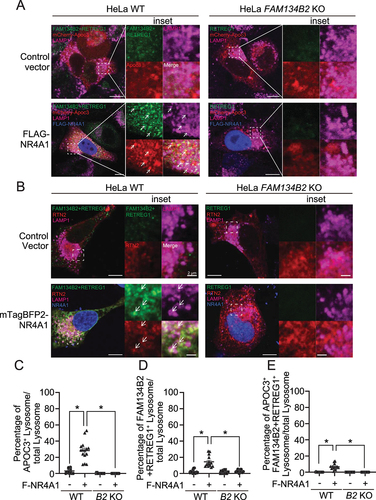
Figure 7. MEF2D-NR4A1-FAM134B2 pathway contributes to amino acid homeostasis under AAD. (A, B) Wild-type, NR4A1 KD, MEF2D KD, RETREG1+ FAM134B2 dKO and FAM134B2 KO HeLa cells were plated at 15,000 cells/well and grown overnight. HeLa cells were starved under amino-acid deficient media lacking L-leucine, L-glutamate, L-methionine and L-lysine for 2 days. After addition of 10 μl CCK-8 to media, HeLa cells were incubated for 1 h at 37°C. Absorbance was measured at 450 nm by a 96-well microplate reader. Percent of cell viability was calculated against CCK8 absorbance of HeLa cells at day 0 (before amino acid deficiency) (n = 6, One-way ANOVA). ***P < 0.001. (C) Leu, (D) Met, (E) Glu, and (F) Lys contents in MEF2D KD, NR4A1 KD, and FAM134B2 KO HeLa cells under AAD. HeLa cells were starved under amino acid deficient media excluding L-leucine, L-glutamate, L-methionine and L-lysine for 2 days. Free amino acids were extracted with acetonitrile: methanol (1:1) containing 0.1 mM d10-Leu and analyzed with LC-MS/MS. *P < 0.05, **P < 0.01 and ***P < 0.001.
Figure 8. AAD-induced FAM134B2 expression is calcium dependent. (A–C) FAM134B2, MEF2D and NR4A1 mRNA expression in HeLa cells treated with HisOH in the presence of BAPTA. HeLa cells were pretreated with 20 μM BAPTA-AM for 2 h and then treated with 2 mM HisOH for 6 h. (D, E) FAM134B2 and DDIT3 mRNA expression in HeLa cells treated with thapsigargin (TG), tunicamycin (TUN) and ionomycin (ION). HeLa cells were treated with 0.5 mM thapsigargin, tunicamycin and ionomycin for 6 h. (F) Measurement of cytosolic Ca2+ with Fluo-4 DirectTM. HeLa cells in a 96-well microplate were incubated with complete media and 2x Fluo-4 DirectTM reagent for 1 h, and then fluorescence was measured with a microplate reader at every 1 min. Cells were treated with ddH2O (Control) or 2 mM HisOH for 7 min after the start of the measurement. Data was expressed as the mean of fold value against average intensity at pretreatment (values from 0 to 4 min) ±SEM. (n = 4), G) FAM134B2, H) MEF2D, I) NR4A1 and J) DDIT3 expression in HeLa cells treated with HisOH in the presence of PKC and CAMK inhibitor. HeLa cells were pretreated with 10 μM Go6983 or KN-93 for 2 h and then treated with 2 mM HisOH for 6 h. *P < 0.05 and ***P < 0.001.
Table 1. Antibodies used in this study