Figures & data
Figure 1. Knockdown of TSSC4 promoted cancer cell growth. (A–D) Knockdown of TSSC4 increased cell growth in MDA-MB-231 cells. (E–F) Knockdown of TSSC4 increased cell growth in U87 cells. (A, E) Knockdown of TSSC4 by siRNA and expression of the proliferation markers PCNA and CCND1 were demonstrated by western blot. ACTB (actin beta) was used as a loading control (the same hereafter). (B, F) Cell growth was measured by counting the numbers of cells. (C) Cell growth was measured by counting the numbers of colonies formed by individual cells with example images of colonies shown. (D) Cell proliferation was measured by BrdU incorporation assay (OD450). The statistical significance is defined as: *p < 0.05, **p < 0.01, ***p < 0.001. Error bar stands for standard deviation (SD) (the same hereafter).
Figure 2. Overexpression of TSSC4 inhibited cell growth. Vector alone (HA) and TSSC4 (TSSC4-HA) were transfected into MDA-MB-231 and U87 cells and stable cell lines were generated, respectively. (A–C) Cell growth in MDA-MB-231 cells. (D–F) Cell growth in U87 cells. (A, D) TSSC4 overexpression and expression of the proliferation marker CCND1 were demonstrated by western blot. HA tag antibody was used to detect TSSC4 (TSSC4-HA). ACTB was used as a loading control. (B, E) Cell growth was measured by counting the numbers of cells. (C) Cell growth was measured by counting the numbers of colonies formed by individual cells with example images of colonies shown. (F) Cell proliferation was measured by BrdU incorporation assay (OD450).
Figure 3. Knockdown of TSSC4 increased autophagy. TSSC4 knockdown by siRNA in U87 cells was demonstrated in . (A–C) Endogenous autophagy. (D–E) Autophagy induced by starvation of glucose and glutamine (No GP). (A, D) Autophagy was measured by western blotting the protein levels of the autophagy marker protein LC3-II. The lysosomal inhibitor chloroquine (CQ; 20 µM) was used to measure autophagic flux (the same hereafter). Cells were pre-treated with the autophagy inhibitor 3-methyladenine (3-MA) (2 mM) for 1 hour (H) before treatment with CQ for 24 h (the same hereafter). (B, C, E) Autophagy was measured by counting the numbers of LC3 puncta per cells. Cells stably expressing mRFP-LC3B were treated with and without CQ and 3-MA for 24 h. Then, numbers of mRFP-LC3 puncta (representing autophagosomes/autolysosomes) per cell were counted under fluorescence microscope visualization. (B) Examples of images showing mRFP-LC3 puncta. (C, E) Numbers of mRFP-LC3 puncta per cell. ACTB was used as the loading control for western blot.
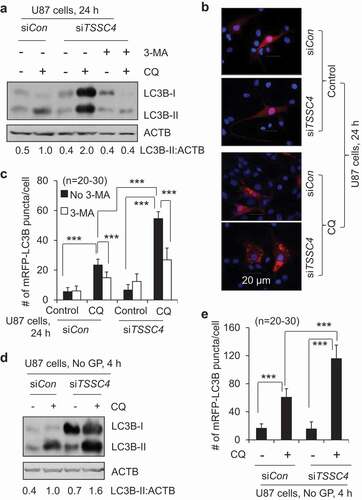
Figure 4. TSSC4 inhibits autophagy by interacting with LC3. (A) Endogenous TSSC4 interacts with LC3-I in A549 cells. Cells were starved of nutrients (without changing medium) for 72 h. Then, cells were further incubated in fresh medium for 2 h before protein harvesting. Immunoprecipitation (IP) of TSSC4 was performed as described in the Materials and Methods section, followed by immunoblotting (IB) of TSSC4 and LC3. TCL, total cell lysate (the same hereafter). (B) A schematic presentation of human TSSC4 protein tagged with (3x) HA at its N-terminal which is encoded by the TSSC4 plasmid, EX-Z7596-M45 (TSSC4-(3x)HA/TSSC4). F97D98C99L100 is the conserved LC3-interacting region (LIR). The TSSC4 mutant, TSSC4M, was generated by changing F97 and L100 to alanine via site-directed mutagenesis. (C) TSSC4 interacts with LC3-I via its conserved LIR. Plasmids HA-EGFP (VECTOR), human TSSC4-HA (TSSC4), and its mutant TSSC4M-HA (TSSC4M), were transfected into U87 cells. Then protein lysates were made for immunoprecipitation (IP) of HA followed by immunoblotting (IB) of HA and LC3. (D) Immunofluorescence microscopy demonstrates the interaction between TSSC4 and LC3-I. U87 cells expressing mRFP-LC3B were performed for immunofluorescence of TSSC4 using the TSSC4 antibody. The diffused distribution of green fluorescence demonstrated TSSC4 expression in the cytosol. Diffused and puncta red fluorescence represent LC3-I (in the cytosol) and LC3-II (on autophagosomes/autolysosomes), respectively. The merged diffused yellow fluorescence demonstrated the interaction between TSSC4 and LC3-I in the cytosol. DAPI (4′,6-diamidino-2-phenylindole) was used to stain the nucleus (blue fluorescence). (E) Overexpression of TSSC4 but not TSSC4M inhibited autophagy. The empty Vector (HA), TSSC4 (TSSC4-HA), and TSSC4M (TSSC4M-HA, were transfected into U87 cells and stable cell lines were developed. Then, the endogenous/basal level of autophagy was measured by western blotting LC3-II and the autophagy substrate SQSTM1 in the absence and presence of CQ (20 µM).
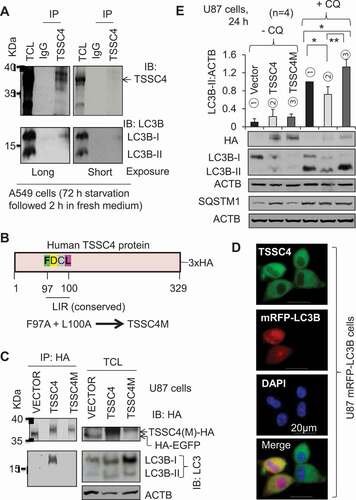
Figure 5. TSSC4 inhibition of cell growth is contributed by its inhibition of autophagy. Vector alone (HA), TSSC4 (TSSC4-HA) and its mutant TSSC4M (TSSC4M-HA) with two amino acids F97 and L100 in the conserved LC3-interacting region (LIR) (FDCL) being mutated to alanine, were transfected into cells and stable cell lines were generated. Cell death was measured by counting the numbers of cells (A, C, E). (A–B) Overexpression of TSSC4 but not its mutant TSSC4M inhibited cell growth in U87 cells. Expression of TSSC4, TSSC4M, was demonstrated by western blot (A). The autophagy inhibitor 3-MA (2 mM) was added on day 0 (A). (B) Cell proliferation was measured by BrdU incorporation assay (OD450). (C) Overexpression of TSSC4 but not its mutant TSSC4M inhibited cell growth in MDA-MB-231 cells. Expression of TSSC4, TSSC4M, and the proliferation marker CCND1 were demonstrated by western blot. TSSC4 and TSSC4 were identified by using HA tag antibody. (D–E) Knockdown of RB1CC1 or BECN1 by siRNAs inhibited cell growth in MDA-MB-231 cells. Knockdown of RB1CC1 or BECN1 as well as the knockown-affected CCND1 protein levels were demonstrated by western blot (D). ACTB was used as the loading control for western blot.
Figure 6. TSSC4 inhibits tumorsphere formation by inhibiting autophagy. The effects of overexpression of TSSC4 and TSSC4M on tumorsphere formation were demonstrated in U87 cells. Stable expression of vector alone, TSSC4, and TSSC4M were shown in . Results were recorded on day 9 of tumorsphere growth. (A) Autophagy was inhibited by overexpression of TSSC4 but not by that of TSSC4M. Autophagy was measured by western blotting of LC3-II in protein lysates of tumorspheres that were pooled from multiple samples under a same condition. CQ (20 µM) was added one day before harvesting tumorspheres. ACTB was used as the loading control for western blot. (B) Example images of maximum sizes of tumorspheres. (C) Total number of tumorspheres per sample. (D) Total number of cells in tumorspheres per sample.
Figure 7. Overexpression of TSSC4 but not TSSC4M in U87 cells inhibited tumor growth. Vector alone, TSSC4, and TSSC4M cells were subcutaneously injected into the immunodeficient NSG mice and tumor growth was monitored as described in the Materials and Methods section. A) Tumor volumes were measured on different days post cancer cell inoculation. Western blot showed the protein levels of TSSC4 (with HA or TSSC4 antibody), the proliferation markers PCNA and CCND1, the apoptosis proteins CASP3 and cleaved (Cl.) CASP3, and the autophagy substrate SQSTM1 in tumor tissues harvested on day 36 post cancer cell inoculation. When HA antibody was used, only overexpressed TSSC4 (TSSC4-HA) and TSSC4M (TSSC4M-HA) were detected. When TSSC4 antibody was used, both endogenous TSSC4 and overexpressed TSSC4 or TSSC4M were detected. (B) Quantification of tumor weights after tumors were dissected on day 36 post cancer cell inoculation. (C) Images of tumors on day 36 post cancer cell inoculation. (D) Example images of mice with tumors on day 36 post cancer cell inoculation. (E) Representative immunofluorescent images of the proliferation marker MKI67 (green, white arrow) in the cancer cells of tumor tissues on day 36 post cancer cell inoculation. (F) Quantification of the percentage of MKI67-positive cells in tumor tissues.
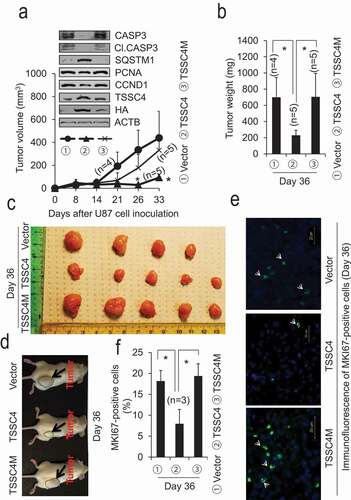
Figure 8. ERBB2 increases TSSC4 expression which inhibits cell growth in breast cancer cells. (A–B) ERBB2 expression increases TSSC4 protein level and cell growth in MDA-MB-231 cells and TSSC4 knockdown in the ERBB2 expressing cells further increases cell growth. (A) Western blot showed expression of ERBB2 and TSSC4, and knockdown of TSSC4. (B) cell growth was measured by cell counting. (C–F) Effects of ERBB2 knockout and TSSC4 overexpression or knockout on cell growth in SKBR3 cells. (C) Western blot showed ERBB2 knockout and TSSC4 expression. (D) Western blot showed expression of Vector (HA), TSSC4 (TSSC4-HA) and TSSC4M (TSSC4M-HA) in SKBR3 ERBB2 knockout cells (NIC-ERBB2). (E) Effects of ERBB2 knockout and TSSC4/TSSC4M overexpression on cell growth that was measured by cell counting. (F) Effect of TSSC4 knockout on cell growth. Western blot showed TSSC4 knockout. NIC-Con, Control cells; NIC-TSSC4, cells with TSSC4 knockout (the same hereafter). ACTB was used as the loading control for western blot.
Figure 9. TSSC4 regulates cell growth in EGFRvIII-expressing U373 glioblastoma (GBM) cells. (A) Western blot showed that expression of EGFRvIII increased the activity of EGFR tyrosine kinase and the level of TSSC4 protein. Phosphorylation of EGFR at Y1068 (P-EGFR, P-EGFRvIII), a major site for EGFR autophosphorylation, represents the activation of EGFR tyrosine kinase. (B) Expression of EGFRvIII increased cell growth in U373 cells. Cell growth was measured by cell counting. (C–D) Knockout of TSSC4 increased cell growth, where the autophagy inhibitor 3-MA (2 mM) decreased growth in control and TSSC4 knockout cells, respectively. Cell growth was measured by cell counting (C) and colony formation assay with example images of colonies shown (D). Western blot demonstrated TSSC4 knockout by CRISPR/Cas-9 technique. NIC-Con, Control cells; NIC-TSSC4, cells with TSSC4 knockout (the same hereafter). (E) TSSC4 knockout increased autophagy which was measured by western blotting of KC3-II in the absence and presence of CQ (20 μM). (F) Knockdown of RB1CC1 inhibited cell growth in control and TSSC4 knockout U373 EGFRvIII cells. Cell growth was measured by cell counting. Western blot demonstrated knockdown of RB1CC1. ACTB was used as the loading control for western blot.
Figure 10. Effect of TSSC4 knockout on tumorsphere formation in U373 EGFRvIII cells. TSSC4 knockout was demonstrated in . Results were recorded on day 10 of tumorsphere growth. (A) TSSC4 knockout increased autophagy in tumorspheres. Autophagy was measured by western blotting LC3-II in protein lysates of tumorspheres that were pooled from multiple samples under a same condition. CQ (20 µM) was added one day before harvesting tumorspheres, and 3-MA (2 mM) was added on day 2 of tumorsphere growth. ACTB was used as the loading control for western blot. (B) Example images of maximum sizes of tumorspheres. (C) Total number of tumorspheres per sample. (D) Total number of cells in tumorspheres per sample.
Figure 11. Knockout of TSSC4 in U373 EGFRvIII cells increased tumor growth. Control (NIC-Con) and TSSC4 knockout (NIC-TSSC4) cells were subcutaneously injected into the immunodeficient NSG mice and tumor growth was monitored as described in the Materials and Methods section. (A) Tumor volumes were measured on different days post cancer cell inoculation. Western blot showed the protein levels of TSSC4, the proliferation markers PCNA and CCND1, the apoptosis proteins CASP3 (caspase 3) and cleaved (Cl.) CASP3, and the autophagy substrate SQSTM1 in tumor tissues harvested on day 35 post cancer cell inoculation. (B) Quantification of tumor weights after tumors were dissected on day 26 and day 35 post cancer cell inoculation, respectively. (C) Images of tumors on day 26 and day 35 post cancer cell inoculation. (D) Example images of mice with tumors on day 35 post cancer cell inoculation. (E) Representative immunofluorescent images of the proliferation marker MKI67 (green, white arrow) in the cancer cells of tumor tissues on day 35 post cancer cell inoculation. (F) Quantification of the percentage of MKI67-positive cells in tumor tissues.
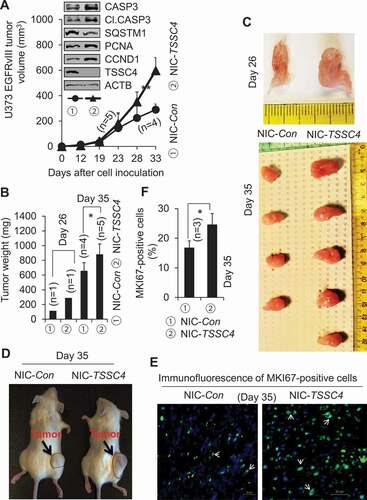
Figure 12. TSSC4 regulates cell death caused by excessive growth. The same number of cells (starting number of cells) was grown in 3 ml of complete medium in each well of 6-well plates without changing medium. Then, cell death was measured by counting the percentage of dead cells after cells were stained with trypan blue (A, C, E, F) or by LDH (lactate dehydrogenase) release assay (absorbance at 490 nm (OD490)) (B, D). The result of LDH release assay was supported by the color change of the phenol red-containing growth medium from red to yellow caused by the release of lactic acid, the end product of the LDH catalyzed reaction (B, D). (A–B) TSSC4 knockdown increased cell death in MDA-MB-231 cells. The starting number of cells on day 0 was 0.2 × 10⁶. Knockdown of TSSC4 was demonstrated in Figure 1A. (C–D) Overexpression of TSSC4 decreased cell death in MDA-MB-231 cells. The starting number of cells on day 0 was 0.5 × 10⁶. Overexpression of TSSC4 was demonstrated in Figure 2A. (E) TSSC4 knockdown increased cell death in U87 cells. The starting number of cells on day 0 was 0.4 × 10⁶. Knockdown of TSSC4 was demonstrated in Figure 1E. (F) Overexpression of TSSC4 decreased cell death in U87 cells. The starting number of cells on day 0 was 0.3 × 10⁶. Overexpression of TSSC4 was demonstrated in Figure 2D.
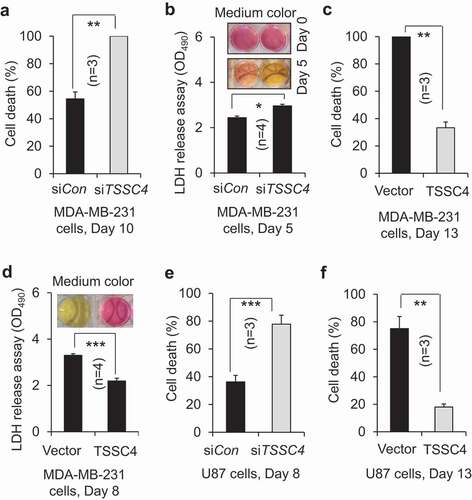
Figure 13. TSSC4 inhibition of cell death during prolonged growth is contributed by its inhibition of autophagy. Cell death was measured by trypan blue staining (A, C, D) and by LDH release assay of absorbance at 490 nm (OD490) with example images of the phenol red-containing growth medium colors (B, E). (A–B) Cell death was decreased by overexpression of TSSC4 but not by that of TSSC4M in MDA-MB-231 cells. The starting number of cells on day 0 was 0.1 × 10⁶ (A). Cell death was measured on day 3, 6, and 8. Overexpression of TSSC4 or TSSC4M was demonstrated in Figure 5C. (C) Effects of overexpression of TSSC4 and TSSC4M on cell death in U87 tumorspheres. Overexpression of TSSC4 or TSSC4M was demonstrated in Figure 5A. (D–E) Cell death was decreased by knockdown of RB1CC1 or BECN1. Cell death was measured on day 3 and 6. Knockdown of RB1CC1 or BECN1 was demonstrated in Figure 5D.
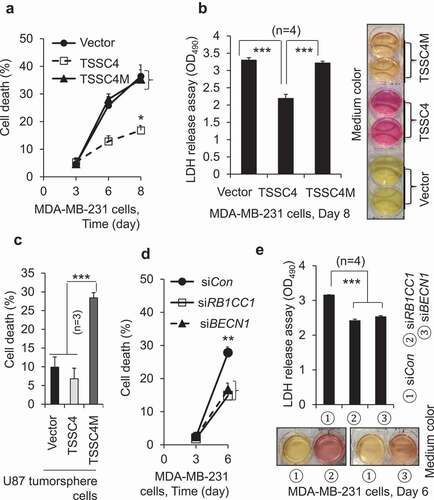
Figure 14. Effects of TSSC4 knockout on cell death during prolonged growth in the absence and presence of 3-MA in U373 EGFRvIII cells. (A) Cell death in monolayer cells. The starting number of cells on day 0 was 0.2 × 10⁶. The autophagy inhibitor 3-MA (2 mM) was added on day 0 and day 4 for the cell death assays on day 3 and day 7, respectively. (B) Cell death in tumorspheres. The autophagy inhibitor 3-MA was added on day 2 of tumorsphere growth. Cell death was measured by trypan blue staining. TSSC4 knockout was demonstrated in Figure 9C.
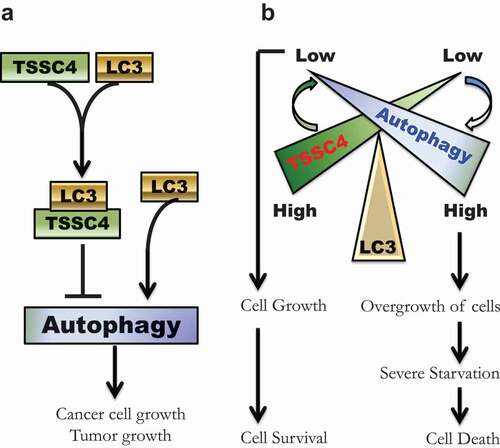
Figure 15. Schematic illustrations of the inhibition of autophagy by TSSC4 and a potential role of TSSC4 in cancer cell growth and growth-associated cell death. (A) A graphic model shows TSSC4 inhibition of autophagy. TSSC4 interacts with the cytosolic LC3-I via its conserved LIR (FDCL). This can prevent the formation of the autophagosome/ autolysosome-bound LC3-II leading to inhibition of autophagy, cell growth and tumor growth. (B) A graphic model illustrates a potential role of TSSC4 in cancer cell growth and growth-associated cell death. When TSSC4 level is high, its interaction with LC3 suppresses autophagy at a low level which promotes cancer cell growth but not overgrowth. Thus, severe starvation might be avoided or delayed, and most cancer cells generated from cell growth will survive. Conversely, when TSSC4 is low, more LC3 will be free from binding to TSSC4. This can significantly increase autophagy levels leading to overgrowth of cancer cells. The rapid growth of cancer cells would quickly deprive the nutrients in their microenvironment resulting in starvation-induced cell death.