
Figures & data
Figure 1. SQSTM1 was a crucial gene in high-glucose-treated keratinocytes. (A and B) representative HE staining of the diabetic skin tissues (DM) and the control (control). Scale bar: 100 μm. Epidermal thicknesses were analyzed. The data are presented as the mean ± s.d. and analyzed by student’s t-test (n = 3 per group). **P < 0.01. (C) Volcano plot revealed 369 upregulated genes and 550 downregulated genes in HaCaT cells treated with high glucose (30 mM) or mannitol (osmotic control) for 48 h (n = 5). The green dot indicates the position of SQSTM1. (D) heat map showed differentially expressed genes in HaCaT cells treated with mannitol or glucose. (E) the cytoHubba plug-in of cytoscape software was used to find the potential key target in HaCaT cells treated with high glucose. (F) PPIN showed interactions between SQSTM1 and other differentially expressed genes in the cluster. (G) the genes enriched in the pathway of epidermis, cytokines and apoptosis were selected to construct the PPI network based on the STRING database for modules with a threshold value>0.4.
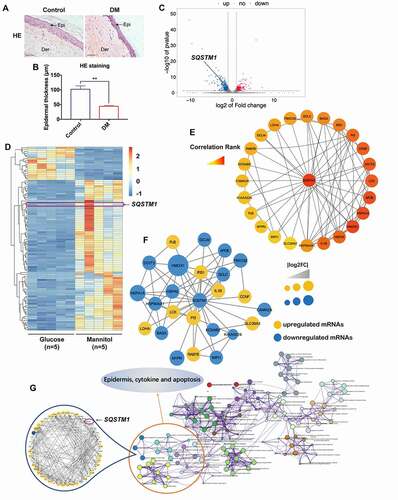
Figure 2. High glucose induced downregulation of SQSTM1 and impairment of autophagic flux in keratinocytes. (A) RT-qPCR analysis of SQSTM1 mRNA expression levels in HaCaT cells treated with high glucose (30 mM of glucose) or mannitol (5.6 mM of glucose + 24.4 mM of mannitol) for 24, 48, and 72 h (n = 3 independent experiments). ACTB (actin beta) was used as an internal control. (B and C) western blot analysis of SQSTM1, MAP1LC3B/LC3B-I, MAP1LC3B/LC3B-II) expression levels in HaCaT cells treated with NG (normal glucose: 5.6 mM of glucose), G (mid-high glucose: 15 mM of glucose; high glucose: 30 mM of glucose), or M (15 mM: 5.6 mM of glucose + 9.4 mM of mannitol; 30 mM: 5.6 mM of glucose + 24.4 mM of mannitol) for 72 h. Quantification results of SQSTM1 protein expression, MAP1LC3B/LC3B-II:-I ratio and MAP1LC3B/LC3B-II:TUBB ratio levels are shown (n = 3 independent experiments). (D, E and F) the HaCaT cells were infected with adenovirus harboring tandem fluorescent mRFP-GFP-MAP1LC3B/LC3B for 24 h, followed by treatment with NG, high glucose (30 mM), or mannitol (osmotic control) for an additional 72 h. Representative images of the HaCaT cells expressing mRFP-GFP-MAP1LC3B/LC3B are shown. Green: GFP puncta, red: mRFP puncta, scale bar: 10 μm. Semi-quantitative analysis of autophagosomes (AP, yellow puncta in merged images) and autolysosomes (AL, red-only puncta in merged images) in high-glucose-treated HaCaT cells. n = 10 randomly selected fields/conditions from 3 independent experiments. (G and H) western blot analysis of SQSTM1, MAP1LC3B/LC3B-I, MAP1LC3B/LC3B-II expression levels in the NHEK cells treated with NG (normal glucose: 5.6 mM of glucose), G (high glucose: 30 mM of glucose), or M (mannitol osmotic control: 30 mM = 5.6 mM of glucose + 24.4 mM of mannitol). Quantification results of SQSTM1 protein expression, MAP1LC3B/LC3B-II:-I ratio and MAP1LC3B/LC3B-II:TUBB ratio levels are shown (n = 3 independent experiments). (I, J and K) the NHEK cells were infected with adenovirus harboring tandem fluorescent mRFP-GFP-MAP1LC3B/LC3B for 24 h, followed by treatment with NG, high glucose (30 mM) or mannitol (osmotic control) for an additional 72 h. Representative images of the NHEK cells expressing mRFP-GFP-MAP1LC3B/LC3B are shown. Green: GFP puncta, red: mRFP puncta, scale bar: 10 μm. Semi-quantitative analysis of autophagosomes (AP, yellow puncta in merged images) and autolysosomes (AL, red-only puncta in merged images) in high-glucose-treated NHEK. n = 10 randomly selected fields/condition from 3 independent experiments. (L) TEM analysis of HaCaT cells treated with high glucose (30 mM) or mannitol (osmotic control) for 72 h. Arrow heads indicate autophagosomes. Arrows indicate autolysosomes and/or lysosomes. Scale bar: 1.0 μm. (M, N) IHC analysis of SQSTM1 and MAP1LC3B/LC3B in skin tissues of diabetic patients and the control group. Scale bar: 100 μm. Quantitative analysis of SQSTM1 and MAP1LC3B/LC3B protein (brown color) levels in the epidermis was performed according to the IRS (n = 3). The data were presented as mean ± s.d. and analyzed by Student’s t-test (A and N), or one-way ANOVA with Fisher’s LSD post hoc analysis (C, F, H and K), or one-way MANOVA with Fisher’s LSD post hoc analysis (E and J). *P < 0.05, **P < 0.01, ***P < 0.001.
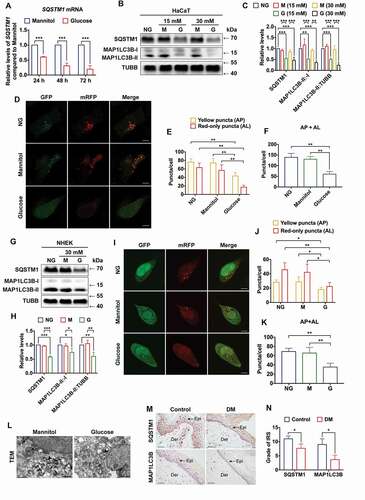
Figure 3. Decrease of SQSTM1 blocked autophagic flux in keratinocytes. (A) RT-qPCR analysis of SQSTM1 mRNA expression levels in control and SQSTM1 knockdown HaCaT cells (n = 3 independent experiments). (B, C) western blot analysis of SQSTM1, KEAP1, and NFE2L2 expression levels in control and SQSTM1 knockdown HaCaT cells. Quantification results of protein expression are shown (n = 3 independent experiments). (D, E) western blot analysis of KEAP1 and NFE2L2 expression levels in HaCaT cells treated with high glucose (30 mM) or mannitol (osmotic control) for 72 h. Quantification results of protein expression are shown (n = 3 independent experiments). (F, G, and H) the HaCaT cells were infected with adenovirus harboring tandem fluorescent mRFP-GFP-MAP1LC3B/LC3B for 24 h, followed by transfection with siRNAs in normal-glucose culture medium. Representative images of the HaCaT cells expressing mRFP-GFP-MAP1LC3B/LC3B are shown. Green: GFP puncta, red: mRFP puncta, scale bar: 10 μm. Semi-quantitative analysis of autophagosomes (AP, yellow puncta in merged images) and autolysosomes (AL, red-only puncta in merged images). n = 10 randomly selected fields/conditions from 3 independent experiments. The data were presented as mean ± s.d. and analyzed by student’s t-test (E), or one-way ANOVA with Fisher’s LSD post hoc analysis (A, C, and H), or one-way MANOVA with Fisher’s LSD post hoc analysis (G). *P < 0.05, **P < 0.01, ***P < 0.001.
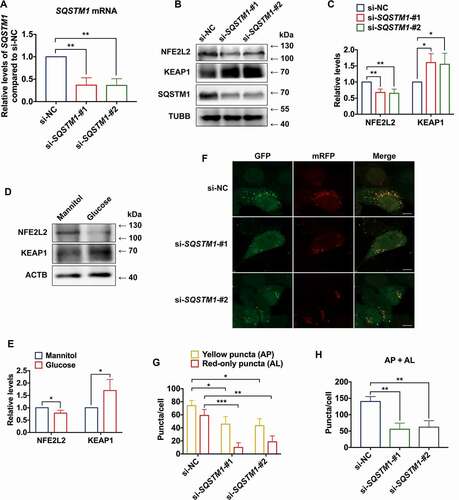
Figure 4. m6A reader protein YTHDC1 interacted with SQSTM1 mRNA in keratinocytes. (A) RT-qPCR analysis of SQSTM1 mRNA expression levels in cytoplasm and nucleus of HaCaT cells treated with high glucose (30 mM) or mannitol (osmotic control) for 72 h (n = 3 independent experiments). (B) RNA dot blot analysis of m6A levels in HaCaT cells treated with high glucose (30 mM) or mannitol (osmotic control) for 72 h. Methylene blue staining served as a loading control. (C) MeRIP-qPCR analysis of m6A levels of SQSTM1 mRNA in HaCaT cells treated with normal glucose (n = 3 independent experiments). (D and E) RIP-qPCR and RNA affinity-isolation analysis of the interaction between YTHDC1 protein and SQSTM1 mRNA in HaCaT cells treated with normal glucose (n = 3 independent experiments). (F and G) western blot analysis of YTHDC1 expression levels in HaCaT cells treated with different concentrations of glucose or mannitol (osmotic control) for 48 and 72 h. Quantification results of YTHDC1 protein expression are shown (n = 3 independent experiments). (H and I) western blot analysis of YTHDC1 expression levels in the NHEK cells treated with normal glucose, mannitol (30 mM osmotic control), or high glucose (30 mM) for 72 h. Quantification results of protein expression are shown (n = 3 independent experiments). (J, K) IHC analysis of YTHDC1 in skin tissues of diabetic patients and the control group. Scale bar: 100 μm. Quantitative analysis of YTHDC1 protein (brown color) levels in the epidermis was performed according to the IRS (n = 3 per group). The data were presented as mean ± s.d. and analyzed by student’s t-test (A, C, D, and K) or one-way ANOVA with Fisher’s LSD post hoc analysis (G and I). *P < 0.05, **P < 0.01, ***P < 0.001.
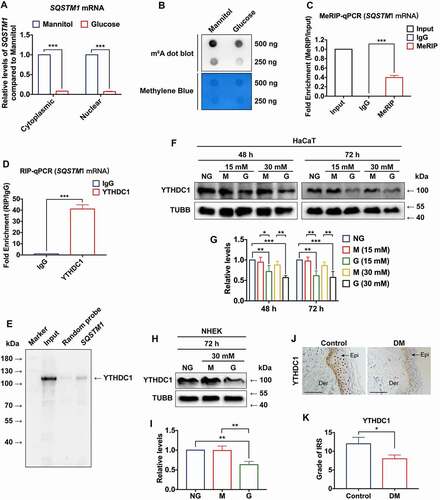
Figure 5. YTHDC1 affects biological functions of keratinocytes. (a and b) RT-qPCR and western blot analysis of YTHDC1 expression levels in control and YTHDC1 knockdown HaCaT cells 48 h after siRNA transfection (n = 3 independent experiments). (C and D) flow cytometry analysis was used to determine cell apoptosis rates of control and YTHDC1 knockdown HaCaT cells 48 h after siRNA transfection. Quantification of cell apoptosis rates is shown (n = 3 independent experiments). (E and F) representative images of in vitro wound-healing assays in HaCaT cells transfected with si-YTHDC1 or si-NC (control siRNA). HaCaT cells were scratched 48 h after siRNA transfection. Images were captured at 0 h and 24 h after the scratch. Semi-quantitative analysis of wound-healing assays is shown (n = 3 independent experiments). The data in A, D, and F were presented as mean ± s.d. and analyzed by one-way ANOVA with Fisher’s LSD post hoc analysis. **P < 0.01, ***P < 0.001.
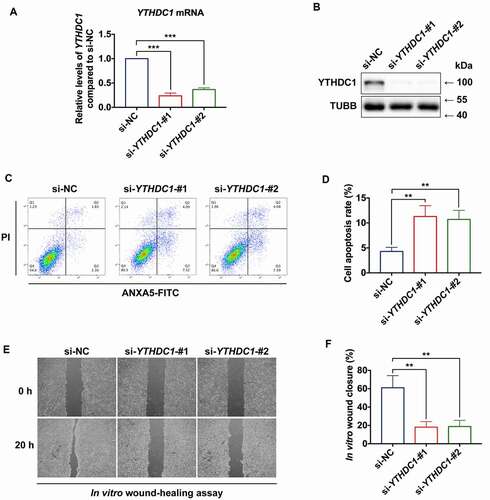
Figure 6. Decreased of YTHDC1 reduced SQSTM1 expression and impaired autophagic flux. (A) RT-qPCR analysis of SQSTM1 mRNA expression levels in control and YTHDC1 knockdown HaCaT cells (n = 3 independent experiments). (B and C) western blot analysis of YTHDC1, MAP1LC3B/LC3B-I, and MAP1LC3B/LC3B-II expression levels in control and YTHDC1 knockdown HaCaT cells. Quantification results of SQSTM1 protein expression, MAP1LC3B/LC3B-II:-I ratio, and MAP1LC3B/LC3B-II:ACTB ratio levels are shown (n = 3 independent experiments). (D, E, and F) the HaCaT cells were infected with adenovirus harboring tandem fluorescent mRFP-GFP-MAP1LC3B/LC3B for 24 h, followed by transfection with siRNAs. Representative pictures of the HaCaT cells expressing mRFP-GFP-MAP1LC3B/LC3B are shown. Green: GFP puncta, red: mRFP puncta, scale bar: 10 μm. Semi-quantitative analysis of autophagosomes (AP, yellow puncta in merged images) and autolysosomes (AL, red-only puncta in merged images). n = 10 randomly selected fields/condition from 3 independent experiments. (G) western blot analysis of YTHDC1, SQSTM1, MAP1LC3B/LC3B-I and MAP1LC3B/LC3B-II expression levels in HaCaT cells overexpressing YTHDC1 (OE-YTHDC1) and the control (OE-Control) with treatment of normal glucose, high glucose (30 mM), or mannitol (30 mM osmotic control) for 72 h. (H) quantification results of YTHDC1 and SQSTM1 protein expression, MAP1LC3B/LC3B-II:-I ratio and MAP1LC3B/LC3B-II:TUBB ratio levels are shown (n = 3 independent experiments). (I, J, and K) the HaCaT cells overexpressing YTHDC1(OE-YTHDC1) and the control (OE-Control) were infected with adenovirus harboring tandem fluorescent mRFP-GFP-MAP1LC3B/LC3B for 24 h, followed by treatment with normal glucose, high glucose (30 mM), or mannitol (30 mM osmotic control) for an additional 72 h. Representative images of the HaCaT cells expressing mRFP-GFP-MAP1LC3B/LC3B are shown. Green: GFP puncta, red: mRFP puncta, scale bar: 20 μm. Semi-quantitative analysis of autophagosomes (AP, yellow puncta in merged images) and autolysosomes (AL, red-only puncta in merged images). n = 10 randomly selected fields/conditions from 3 independent experiments. The data were presented as mean ± s.d. and analyzed by one-way ANOVA with Fisher’s LSD post hoc analysis (A, C, F, H, and K) or one-way MANOVA with Fisher’s LSD post hoc analysis (E and J). *P < 0.05, **P < 0.01, ***P < 0.001.
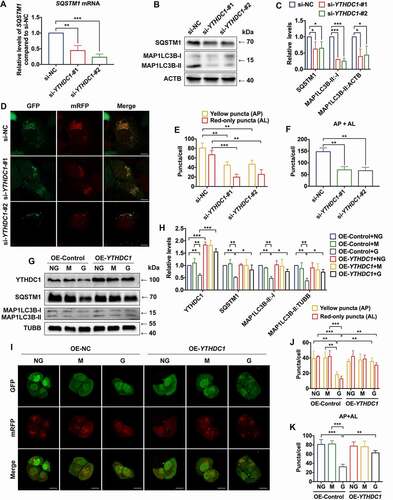
Figure 7. YTHDC1 cooperated with ELAVL1 in regulating expression of SQSTM1. (A) RT-qPCR analysis of SQSTM1 mRNA expression levels in the cytoplasm and nucleus of control and YTHDC1 knockdown HaCaT cells (n = 3 independent experiments). (B and C) the distribution of ACTB and RNU6–1/U6 mRNA in the cytoplasm and nucleus of control and YTHDC1 knockdown HaCaT cells (n = 3 independent experiments). (D and E) control and YTHDC1 knockdown HaCaT cells were treated with actinomycin D (5 μg/mL) for 0, 3, 6 h. The expression levels of SQSTM1 mRNA in the cytoplasm and nucleus were analyzed by RT-qPCR (n = 3 independent experiments). (F and G) Co-IP analysis of the interaction between YTHDC1 and ELAVL1 from HaCaT lysate. (H and I) RNA affinity-isolation and RIP-qPCR analysis of the interaction between ELAVL1 protein and SQSTM1 mRNA (n = 3 independent experiments). (J and K) RT-qPCR and western blot analysis of ELAVL1 expression levels in control and ELAVL1 knockdown HaCaT cells (n = 3 independent experiments). (L) RT-qPCR analysis of SQSTM1 mRNA expression levels in control and ELAVL1 knockdown HaCaT cells (n = 3 independent experiments). The data were presented as mean ± s.d. and analyzed by student’s t-test in (I) or one-way ANOVA with Fisher’s LSD post hoc analysis in (A), (D), (E), (J), and (L). *P < 0.05, **P < 0.01, ***P < 0.001 as compared with the si-NC groups.
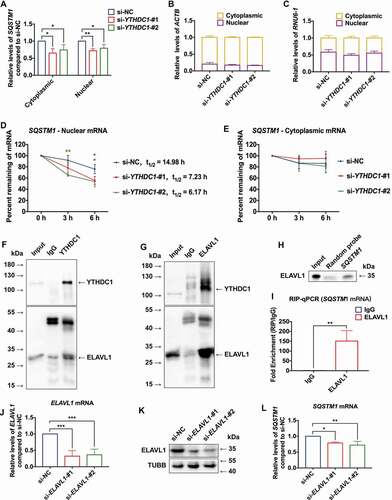
Figure 8. Decreased YTHDC1 inhibited autophagy in keratinocytes and delayed diabetic wound healing in mice. (A and B) immunohistochemical staining and analysis of YTHDC1, SQSTM1, and MAP1LC3B/LC3B protein expression in the skin tissues of db/db mice and WT mice. Scale bar: 100 μm. Quantitative analysis of YTHDC1, SQSTM1, and MAP1LC3B/LC3B protein (brown color) levels in the epidermis was performed according to the IRS (n = 7 per group). (C and D) representative images of cutaneous wounds of db/db mice and WT mice on day 0, 2, 4, 6, and 8 after wound generation by surgical excision. Rates of wound closure were quantified by using imageJ software and were expressed by the percentage of closed wound area (n = 7 per group). (E) illustration of experimental timeline for the siRNA injection and wound healing model of mice. (F and G) immunohistochemical staining and analysis of YTHDC1, SQSTM1, and MAP1LC3B (LC3B) protein expression in skin tissues of mice injected with control siRNA, Ythdc1 siRNA or Sqstm1 siRNA. Epi: epidermis, Der: dermis. Scale bar: 100 μm. Quantitative analysis of YTHDC1, SQSTM1, and MAP1LC3B/LC3B protein (brown color) levels in the epidermis was performed according to the IRS (n = 6 or 7 per group). (H and I) representative images of cutaneous wounds of mice injected with siRNAs on day 0, 2, 4, 6, and 8 after wound generation by surgical excision. Rates of wound closure were quantified by using imageJ software and were expressed by the percentage of closed wound area (n = 6 or 7 per group). The data were presented as mean ± s.d. (B and G) or mean ± SEM (D and I) and analyzed by student’s t-test (B and D) or one-way ANOVA with Fisher’s LSD post hoc analysis (G and I). *P < 0.05, **P < 0.01, ***P < 0.001.
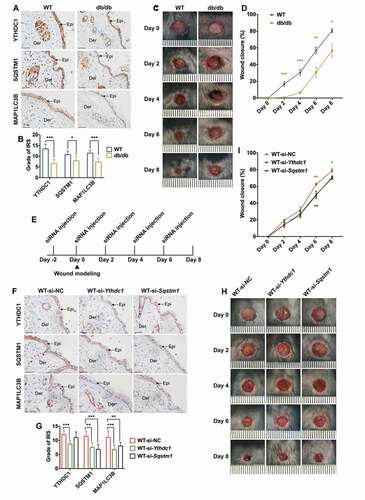
Figure 9. Proposed working model of YTHDC1 in regulation of autophagy in keratinocytes of diabetic skin. YTHDC1 interacted and cooperated with ELAVL1 in regulating the expression of SQSTM1 in keratinocytes. In diabetes, downregulation of YTHDC1 induced decreased expression levels of SQSTM1 via acceleration of SQSTM1 nuclear mRNA decay, which led to the impairment of autophagic flux and keratinocyte migration, eventually resulting in delayed wound healing.
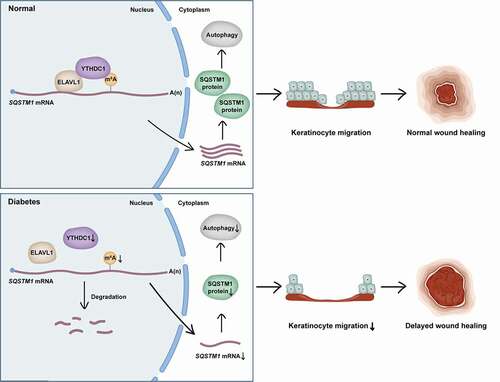
Table 1. Primer sequences
Table 2. Primary antibodies used in this study
Table 3. siRNA sequences