Figures & data
Figure 1. FAIM is overexpressed in lung adenocarcinoma and correlates with poor survival of lung adenocarcinoma patients. (A) The mRNA level of FAIM isoforms in lung adenocarcinoma cell lines (A549, H1299, H292, SPC-A1, H358) were determined by Q-PCR using specific primers. Data represent the average of three independent experiments (mean ± SD). ***, P < 0.001. (B) The protein expression of FAIM in lung adenocarcinoma cell lines (H1299, SPC-A1, H292, PC9, H1975, HCC827, H358, A549) and human bronchial epithelial cells (HBE) were determined by western blot with the indicated antibodies. (C) FAIM expression in tumor tissues (T) and adjacent normal tissues (N) from 18 NSCLC patients were determined by western blot with the indicated antibodies. (D) Immunohistochemical staining of a representative lung adenocarcinoma tissue microarray with FAIM antibody. T, tumor tissue; N, adjacent normal tissue. (E) Quantification of the immunohistochemical (IHC) staining shown in Figure 1D. (F) Microscopy evaluation of IHC staining of two representative tumor tissues and adjacent normal tissues shown in Figure 1D with FAIM antibody (brown) and hematoxylin counterstain (blue). Scale bars: 100 μm. (G) Kaplan-Meier survival curve of 90 lung adenocarcinoma patients. Patients were divided into two groups according to the average staining density of FAIM in cancer tissues of the tissue array (High expression: n = 42, low expression: n = 48, Log-rank (Mantel-Cox) test was used for the statistical analysis).
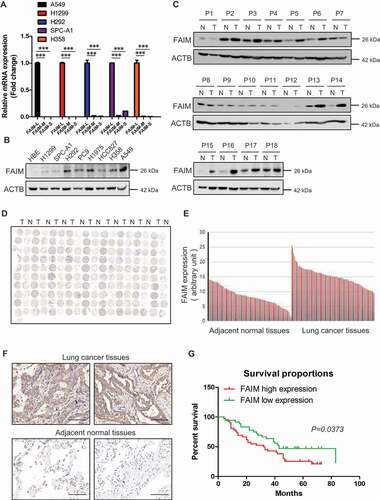
Figure 2. FAIM knockdown inhibits proliferation of lung adenocarcinoma cells and promotes lung differentiation events in xenograft models. (A-D) The lung adenocarcinoma cells A549(A), H1299(B), H292(C), SPC-A1(D) were cultured in RPMI 1640 with 10% FBS, cells were transfected with control siRNA (CON-si) or FAIM siRNAs (FAIM-si1, FAIM-si2). Twenty-four h later, cells were seeded in 24-well plates at 5000 cells per well in 0.5 ml complete culture medium. At indicated time, cells were fixed in 3.7% formaldehyde and stained with 0.1% crystal violet. Data represent the average of three independent experiments (mean ± SD). ***, P < 0.001 (upper panel). The lung adenocarcinoma cells were transfected with indicated siRNAs and 500 cells were seeded in 6-well plate. 10 days later, cells were fixed in 3.7% formaldehyde and stained with 0.1% crystal violet and the photographs were taken (middle panel). The knockdown efficiency of FAIM was detected by western blot using the indicated antibodies (bottom panel). (E) A549 control cells (A549-CON) and FAIM knockdown stable cell lines (A549-shFAIM) were subcutaneously injected into the flanks of nude mice. Four weeks later, tumors were dissected out and photomicrographs were taken. (F) The weights and volume of tumors in Figure 2E were measured. The p value was calculated by paired t-test, ***, P < 0.001. (G) Photomicrographs of hematoxylin-eosin (HE) staining for tumors induced by A549-CON cells and A549-shFAIM cells. Scale bars: 100 μm. (H and I) Immunohistochemical staining in tumors induced by A549-CON cells and A549-shFAIM cells for MKI67 (H) and NKX2-1 (I). Scale bars: 100 μm.
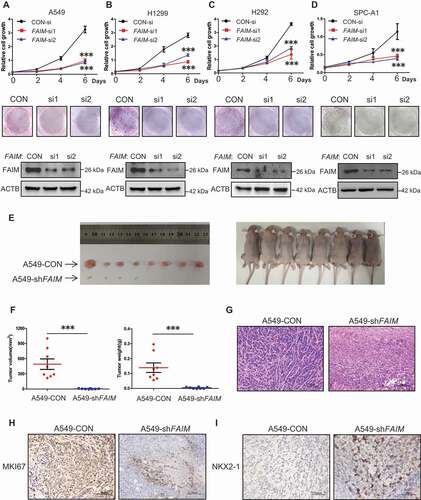
Figure 3. Knocking down FAIM suppresses cancer cell proliferation through inducing autophagy. (A and B) A549 (A) and H1299 (B) cells were transfected with control siRNA (CON-si) or FAIM siRNAs (FAIM-si1, FAIM-si2). Forty-two h later, the cells were treated with or without 20 μM chloroquine (CQ) for 6 h. Immunofluorescence was performed using LC3B antibody and then analyzed by fluorescence microscopy (Olympus IX83). Scale bar: 30 μm (Left panel). The cell numbers with LC3B puncta were counted under 200× magnification. *, P < 0.05; **, P < 0.01; ***, P < 0.001 (Right panel). (C) A549 cells were transfected with control siRNA (CON-si) or FAIM siRNAs (FAIM-si1, FAIM-si2). Forty-eight h later, the cells were lysed and western blot was performed to detect the expression of the indicated proteins. (D) A549 cells were transfected with control siRNA (CON-si) or FAIM siRNAs (FAIM-si1, FAIM-si2). Forty-two h later, the cells were treated with or without 20 μM chloroquine (CQ) for 6 h. Western blot was used to detect the expression of the indicated proteins. (E and F) A549 (E) and H1299 (F) cells were transfected with control siRNA (CON-si) or FAIM siRNAs (FAIM-si1, FAIM-si2). Twenty-four h later, cells were seeded in 24-well plates at 5000 cells per well in 0.5 ml complete culture medium treat with or without Chloroquine (CQ). On the 6th day, cells were fixed in 3.7% formaldehyde and stained with 0.1% crystal violet. Data represent the average of three independent experiments (mean ± SD). **, P < 0.01.
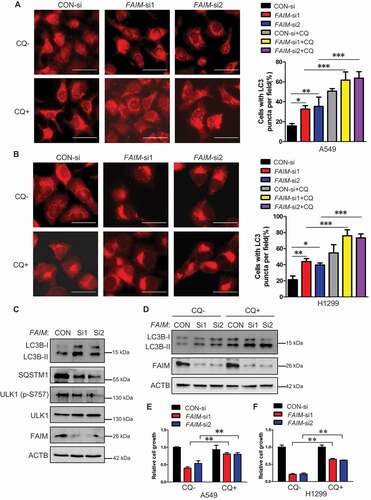
Figure 4. FAIM regulates autophagy through modulating the activation of MTOR pathway. (A) A549 cells were transfected with pcDNA3.1-HA empty vector or pcDNA3.1-HA-FAIM. Forty-eight h later, the cells were lysed and western blot was performed to detect the expression of the indicated proteins. (B) A549 cells were transfected with control siRNA or FAIM siRNAs. Forty-eight h later, the cells were lysed and western blot was performed to detect the expression of the the indicated proteins. (C) A549 control cells and FAIM knockdown stable cell lines were lysed and western blot was performed to detect the expression of the indicated proteins. (D) Immunofluorescence was performed using the indicated antibodies in A549 control cells and FAIM knockdown stable cell lines. Scale bar: 30 μm. (E) A549 cells were transfected with pcDNA3.1-HA empty vector or pcDNA3.1-HA-FAIM. Forty-eight h later, the cells were lysed and the production of α-ketoglutarate (α-KG) was measured. Data represent the average of three independent experiments (mean ± SD). *, P < 0.05. (F) A549 cells were transfected with control siRNA or FAIM siRNAs. Forty-eight h later, the cells were lysed and the production of α-ketoglutarate (α-KG) was measured. Data represent the average of three independent experiments (mean ± SD). *, P < 0.05. (G) A549 cells transfected with control siRNA or FAIM siRNAs were treated with or without 5 mM dimethyl α-ketoglutarate. Forty-eight h later, the cells were lysed and western blot was performed to detect the expression of the indicated proteins. (H) A549 control cells and FAIM knockdown stable cell lines were treated with or without 5 mM dimethyl α-ketoglutarate. Forty-eight h later, the cells were lysed and western blot was performed to detect the expression of the indicated proteins. (I) A549 cells transfected with control siRNA or FAIM siRNAs were treated with or without dimethyl α-ketoglutarate. Immunofluorescence was performed using LC3B antibody and analyzed by fluorescence microscopy (Olympus IX83). Scale bar: 30 μm (Upper panel). The cell numbers with LC3B puncta were counted under 200× magnification. **, P < 0.01; ***, P < 0.001 (Bottom panel). (J) A549 control cells and FAIM knockdown stable cell lines were treated with or without dimethyl α-ketoglutarate. Immunofluorescence was performed using LC3B antibody and analyzed by fluorescence microscopy (Olympus IX83). Scale bar: 30 μm (Upper panel). The cell numbers with LC3B puncta were counted under 200× magnification. ***, P < 0.001 (Bottom panel).
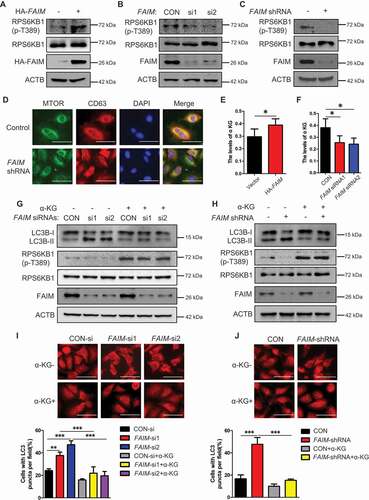
Figure 5. FAIM regulates the tetramer formation of GAC. (A) A549 cells were transfected with empty vector or pcDNA3.1-HA-FAIM and mitochondria were isolated and glutaminase activity was measured. Data represent the average of three independent experiments (mean ± SD). **, P < 0.01. (B) A549 cells were transfected with control siRNA or FAIM siRNAs. Forty-eight h later, mitochondria were isolated and glutaminase activity was measured. Data represent the average of three independent experiments (mean ± SD). *, P < 0.05. (C and D) Mitochondria were isolated from A549 (C) and H1299 cells (D). The expression of mitochondria and cytosolic proteins were detected by western blot. (E) A549 cells were transfected with empty vector or pcDNA3.1-HA-FAIM and immunoprecipitation was performed followed by western blot. (F) A549 cells were transfected with indicated plasmids. The cells were lysed and analyzed using 4–16% Native PAGE, followed by immunoblot analysis. (G) A549 cells were transfected with the indicated siRNAs. The cells were lysed and analyzed using 4–16% Native PAGE, followed by immunoblot analysis. (H) A549 control cells and FAIM knockdown stable cell lines were lysed and analyzed using 4–16% Native PAGE, followed by immunoblot analysis. (I) A549 cells were transfected with pcDNA3.1-V5-GAC (WT GAC) or pcDNA3.1-V5-GAC mutants (GACS314A, GACS314D), then analyzed using 4–16% Native PAGE, followed by immunoblot analysis. (J) A549 cells were transfected with the indicated plasmids. The cells were lysed and analyzed using 4–16% Native PAGE, followed by immunoblot analysis. (K) A549 cells were co-transfected with the indicated plasmid and siRNAs. The cells were lysed and analyzed using 4–16% Native PAGE, followed by immunoblot analysis. (Figure F-K: GAC-T: GAC tetramer; GAC-M: GAC monomer). (L) A549 cells were co-transfected with pcDNA3.1-V5-GAC and the indicated siRNAs. Forty-eight h later, the cells were lysed and immunoprecipitation was performed followed by western blot. (M) A549 cells were transfected with indicated plasmids. Forty-eight h later, the cells were lysed and immunoprecipitation was performed. The expression of the indicated proteins was examined by western blot.
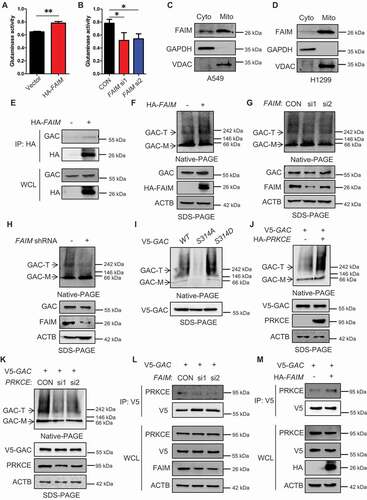
Figure 6. FAIM regulates the stability of GAC. (A) A549 control cells and FAIM knockdown stable cell lines were treated with 25 μg/ml cycloheximide (CHX) for different times and the expression of the indicated proteins were detected by western blot. (B) A549 cells were co-transfected with pcDNA3.1-V5-CLPP and the indicated siRNAs. Forty-eight h later, the cells were lysed and western blot was performed. (C) A549 control cells and FAIM knockdown stable cell lines were transfected with or without pcDNA3.1-V5-CLPP. Forty-eight h later, the cells were lysed and western blot was performed. (D) A549 cells were transfected with the indicated plasmids or siRNAs. Forty-two h later, the cells were treated with CHX for indicated times. Western blot was used to detect the expression of the indicated proteins. Relative GAC expression over ACTB was quantified. (E) A549 cells were transfected with pcDNA3.1-V5 empty vector or pcDNA3.1-V5-CLPP. Forty-eight h later, the cells were lysed and immunoprecipitation was performed. The expression of the indicated proteins was examined by western blot. (F) A549 cells were co-transfected with pcDNA3.1-V5-CLPP and the indicated siRNAs. Forty-eight h later, the cells were lysed and immunoprecipitation was performed. The expression of the indicated proteins was examined by western blot. (G) A549 control cells and FAIM knockdown stable cell lines were transfected with pcDNA3.1-V5-CLPP. Forty-eight h later, the cells were lysed and immunoprecipitation was performed. The expression of the indicated proteins was examined by western blot. (H) A549 cells were transfected with WT GAC, GACS314A and GACS314D plasmids followed by treatment with CHX for different times. Western blot was used to detect the expression of the indicated proteins. Relative GAC expression over ACTB was quantified. (I) A549 cells were transfected with the indicated plasmids or siRNAs followed by treatment with CHX for different times. Western blot was used to detect the expression of the indicated proteins. Relative GAC expression over ACTB was quantified.
Figure 7. FAIM suppresses the interaction between ULK1 and MTOR in cytoplasm. (A) H1299 cells were lysed and immunoprecipitation was performed using the indicated antibodies. Western blot were used to detect protein expression. (B) H1299 cells were transfected with or without pcDNA3.1-HA-FAIM. Forty-eight h later, the cells were lysed and immunoprecipitation was performed. The expression of the indicated proteins was examined by western blot. (C) H1299 cells were transfected with pCMV-HA-ULK1 and the indicated siRNAs. Forty-eight h later, the cells were lysed and immunoprecipitation was performed. The expression of the indicated proteins was examined by western blot. (D) H1299 cells were co-transfected with pCMV-HA-ULK1 and pcDNA3.1-HA-FAIM. Forty-eight h later, the cells were lysed and immunoprecipitation was performed. The expression of the indicated proteins was examined by western blot. (E) A549 cells were transfected with pcDNA3.1-His-FAIM-ΔN. Forty-eight h later, Mitochondria were isolated and the mitochondria and cytosolic proteins were detected by western blot. (F) A549 cells were transfected with pcDNA3.1-His-FAIM-ΔN. Forty-eight h later, the cells were lysed and western blot was performed to detect the expression of the indicated proteins. (G) A549 cells were transfected with pcDNA3.1-His-FAIM-ΔN. Forty-eight h later, the cells were lysed and the production of α-ketoglutarate (α-KG) was measured. Data represent the average of three independent experiments (mean ± SD). ns, P > 0.05. (H) A549 cells were transfected with pcDNA3.1-His-FAIM-ΔN. Forty-eight h later, mitochondria were isolated and glutaminase activity was measured. Data represent the average of three independent experiments (mean ± SD). ns, P > 0.05. (I) A549 cells were transfected with or without pcDNA3.1-His-FAIM-ΔN. Forty-eight h later, the cells were lysed and immunoprecipitation was performed. The expression of the indicated proteins was examined by western blot. (J) A549 cells were co-transfected with pCMV-HA-ULK1 and pcDNA3.1-His-FAIM-ΔN. Forty-eight h later, the cells were lysed and immunoprecipitation was performed. The expression of the indicated proteins was examined by western blot.
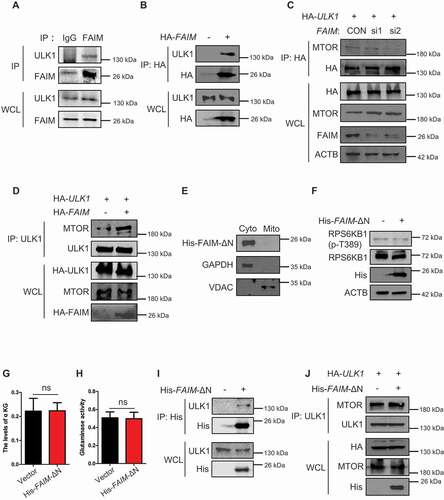
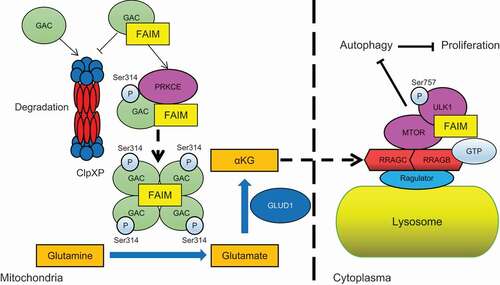
Figure 8. The proposed working model for the regulation of autophagy by FAIM.