Figures & data
Figure 1. Identification of ER proteins that interact with the EBOV structural GP. (a) FLAG-tagged EBOV-GP and EBOV-GP∆MLD were expressed in HEK293T cells and purified with an anti-FLAG affinity column. Purified proteins were analyzed by SDS-PAGE followed by silver staining (top gel) or WB (bottom gel). (b) Affinity-purified EBOV glycoprotein complexes were analyzed by liquid chromatography tandem mass spectrometry (LC-MS/MS). Identified ER proteins that interact with both GP and GP∆MLD are listed. (c) GP and GP∆MLD with a N-terminal FLAG-tag were expressed with PDIA3/ERp57 or HSPA5/BiP in HEK293T cells, and their expression was determined by WB. (d) Flag-tagged GP, GP∆MLD, and GFP were expressed with PDIA3 and pulled down by anti-PDIA3. Proteins in cell lysate and immunoprecipitation (IP) samples were determined by WB. (e) GP and GP∆MLD were expressed in HEK293T WT and PDIA3-KO cells and their expression was determined by WB. (f) sGP and ssGP with a N-terminal HiBiT-tag were expressed with PDIA3 in HEK293T cells, and their expression was determined by the Nano-Glo® HiBiT Blotting System. (g) HEK293T cells were transfected with 1 μg PDIA3 and 1 μg GP or GP∆MLD expression vectors. Alternatively, HEK293T WT and PDIA3-KO cells were transfected with 1 μg GP or GP∆MLD expression vectors. GP expression on the cell surface was determined by flow cytometry. (h) HEK293T cells were transfected with increasing amounts of a GP expression vector. GP and the endogenous PDIA3 expression were determined by WB. (i) HEK293T WT and PDIA3-KO cells were transfected with 1 μg GP expression vector and increasing amounts of an PDIA3 expression vector. GP and PDIA3 expression were detected by WB. The levels of GP expression in C, E, F, and I, and those of PDIA3 expression in H were further quantified from these Western blots by ImageJ and are presented under each of these blots. Results are shown as relative values, with the value from a control (Ctrl) vector set as 1. Error bars represent the standard error of measurements (SEMs) calculated from three experiments. *p < 0.05, **p < 0.01, ***p < 0.001, ****p < 0.0001, ns (not significant, p > 0.05).
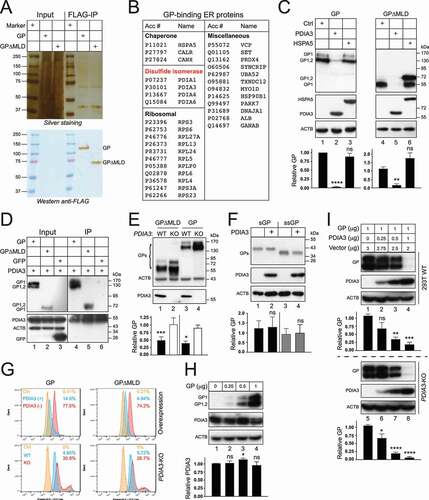
Figure 2. PDIA3 inhibits EBOV entry. (a) HIV-1 firefly luciferase reporter viruses pseudotyped with GP or GP∆MLD were produced from HEK293T WT, PDIA3-overexpressing, or PDIA3-KO cells. After infecting HEK293T cells with an equal number of these different viruses, viral entry was determined by measuring intracellular luciferase activities. Viral entry is shown as relative values, with the entry of GP∆MLD-pseudotyped viruses in the absence of PDIA3 normalized to 100%. (b) EBOV virus-like particles (VLPs) were produced from HEK293T WT, PDIA3-overexpressing, or PDIA3-KO cells after expression of GP and EBOV-VP40. VLPs were purified by ultra-centrifugation and analyzed by WB. Levels of GP in virions were further quantified from these Western blots and are presented as relative values as previously. (c) EBOV replication and transcription-competent virus-like particles (trVLPs) were produced and passaged two times (p0, p1, p2) in HEK293T cells in the presence or absence of PDIA3. EBOV replication was determined by measuring intracellular Renilla luciferase activity. Viral replication was also measured in the absence of EBOV-L, which is a negative control. Results from three independent experiments are presented. Error bars in A and B represent SEMs calculated from three independent experiments. *p < 0.05, **p < 0.01, ***p < 0.001, ****p < 0.0001, ns (p > 0.05).
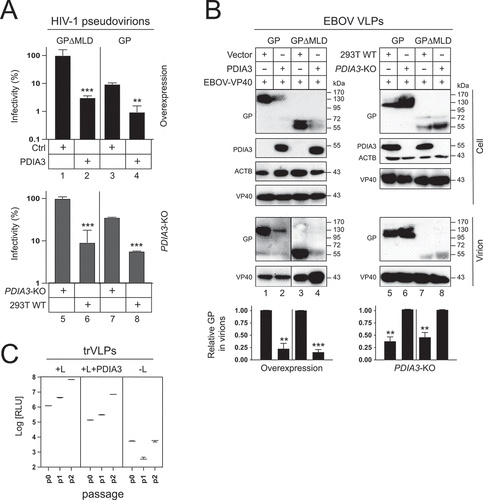
Figure 3. PDIA3 targets cysteine residues in EBOV-GP. (a) HEK293T cells were transfected with PDIA3 and GP expression vectors and treated with increasing concentrations of nitazoxanide (NTZ) or its circulating-metabolite tizoxanide (TIZ). GP expression was analyzed by WB. (b) A schematic diagram of PDIA3 is presented on the top. Two catalytic TLDs, a (blue) and a’ (green) that contain the canonical CGHC active motif, two non-catalytic TLDs, b (purple) and b’ (Orange), and an ER-retention signal (purple) are shown. Indicated PDIA3 mutants were expressed with GP in HEK293T cells and their effect on GP expression was determined by WB. (c) A schematic diagram of EBOV-GP is presented on the top. Ten cysteine residues located within GP1 and GP2 are indicated. Cysteine residues that form one intermolecular and four intramolecular disulfide-bonds are linked by lines. Indicated GP mutants were expressed with PDIA3 in HEK293T cells, and their expression was analyzed by WB. The levels of GP expression in A, B, and C were further quantified and are presented similarly as we did previously. Error bars represent SEMs calculated from three independent experiments. *p < 0.05, **p < 0.01, ***p < 0.001, ****p < 0.0001, ns (p > 0.05).
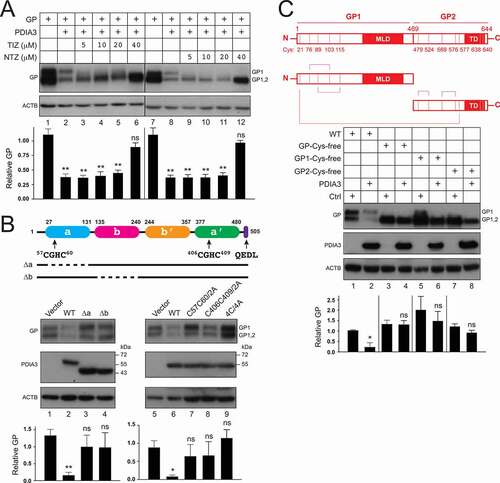
Figure 4. EBOV-GP induces UPR and is targeted by ERAD machinery. (a) HEK293T cells were transfected with a GP or SERPINA1 expression vector and pLightSwitch-BiP, pXBP1u-FLuc, pATF4-UTR-Fluc, or p5× ATF6-GL3. Luciferase activities were measured and are presented as relative values, with the activities in the presence of SERPINA1 normalized to 100%. (b) GP and VSV-G were expressed in HEK293T cells with increasing amounts of SERPINA1 and their expression was analyzed by WB. (c) GP, IAV-HA, and VSV-G were expressed with PDIA3 in HEK293T cells and treated with 0.1 µM thapsigargin (TGN). In addition, GP was expressed with PDIA3 and treated with 1 mM 4-phenylbutyrate (4-PBA). DMSO was used as a vehicle control. Viral protein expression was analyzed by WB. (d) GP and PDIA3 were expressed in HEK293T cells and treated with 20 μM lactacystin (Lac) or 50 μM kifunensine (KIF). DMSO was used as a vehicle control. GP expression was analyzed by WB. (e) GP and VSV-G were expressed with EDEM1, EDEM2, EDEM3, or MAN1B1 in HEK293T cells and their expression was analyzed by WB. GFP was used as a control. EDEM1, EDEM2, EDEM3, MAN1B1, and GFP were detected by an anti-FLAG. (f) GP was expressed with FLAG-tagged GFP, MAN1B1, EDEM1, EDEM2, or EDEM3 in HEK293T cells. Proteins were pulled down by anti-GP and analyzed by WB. (G) GP was expressed with MAN1B1, EDEM1, EDEM2, and their catalytic site-deficient mutants in HEK293T cells, and their expression was analyzed by WB. The levels of GP expression in B, C, D, E, and G were further quantified. Error bars represent SEMs calculated from three independent experiments. *p < 0.05, **p < 0.01, ***p < 0.001, ****p < 0.0001, ns (p > 0.05).
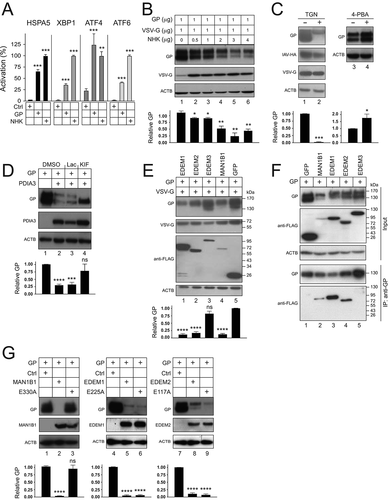
Figure 5. EBOV-GP is targeted to lysosomes via macroautophagy/autophagy. (a) GP and PDIA3 were expressed in HEK293T cells and treated with 20 μM lactacystin (Lac), 20 μM MG132, 100 nM bafilomycin A1 (BafA1), and 20 nM concanamycin A (ConA). DMSO was used as a vehicle control. GP expression was analyzed by WB. (b) GP and PDIA3 were expressed in HEK293T cells in the presence of LAMP-2A-siRNA and their expression was analyzed by WB. (c) GP and PDIA3 were expressed in HEK293T cells and treated with 10 mM 3-methyladenine (3-MA) or 20 μM LY294002 (LY). Their expression was analyzed by WB. (d) GP and PDIA3 were expressed in indicated WT, ATG3-KO, and ATG5-KO cells and their expression was analyzed by WB. (e) GP and PDIA3 were expressed in indicated WT and SQSTM1-KO cells and their expression was analyzed by WB. (f) GP and PDIA3 were expressed in A549 WT and HDAC6-KO cells and protein expression was analyzed by WB. (g) GP was expressed with LAMP1-dsRed in the presence or absence of a PDIA3 expression vector in HeLa cells. Cells with ectopic PDIA3 were treated with DMSO or 100 nM BafA1. The colocalization of GP with LAMP1 was determined by confocal microscopy after staining GP with its specific antibody. The levels of GP expression in A, B, C, D, E, and F were further quantified. Error bars represent SEMs calculated from three independent experiments. *p < 0.05, **p < 0.01, ***p < 0.001, ****p < 0.0001, ns (p > 0.05).
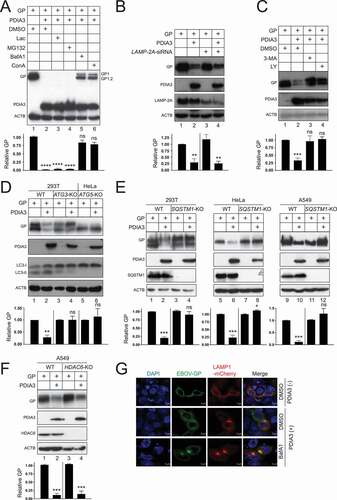
Figure 6. EBOV-GP is ubiquitinated and degraded in the presence of PDIA3. (a) GP was expressed with WT Ub or indicated Ub mutants in HEK293T cells in the presence or absence of PDIA3. Protein expression was analyzed by WB. (b) GP was expressed with WT Ub or indicated Ub mutants in HEK293T WT and PDIA3-KO cells. Protein expression was analyzed by WB. (c) GP was expressed with increasing amounts of WT Ub or Ub[7 K/R] in the presence or absence of PDIA3 in HEK293T cells. Protein expression was analyzed by WB. (d) GP was expressed with UbK48,63R in the presence or absence of PDIA3 in HEK293T cells. GP was pulled down by anti-FLAG and protein expression in cell lysate (Input) and IP samples was analyzed by WB. (e) GP was expressed in the presence or absence of PDIA3 in HEK293T cells. Cells were treated with 50 μM cycloheximide (CHX) in the presence or absence of 100 nM BafA1. Cells were collected at indicated time points and protein expression was analyzed by WB. The levels of GP in A, B, C, D, and E were further quantified. Error bars represent SEMs calculated from three independent experiments. *p < 0.05, **p < 0.01, ***p < 0.001, ****p < 0.0001, ns (p > 0.05).
![Figure 6. EBOV-GP is ubiquitinated and degraded in the presence of PDIA3. (a) GP was expressed with WT Ub or indicated Ub mutants in HEK293T cells in the presence or absence of PDIA3. Protein expression was analyzed by WB. (b) GP was expressed with WT Ub or indicated Ub mutants in HEK293T WT and PDIA3-KO cells. Protein expression was analyzed by WB. (c) GP was expressed with increasing amounts of WT Ub or Ub[7 K/R] in the presence or absence of PDIA3 in HEK293T cells. Protein expression was analyzed by WB. (d) GP was expressed with UbK48,63R in the presence or absence of PDIA3 in HEK293T cells. GP was pulled down by anti-FLAG and protein expression in cell lysate (Input) and IP samples was analyzed by WB. (e) GP was expressed in the presence or absence of PDIA3 in HEK293T cells. Cells were treated with 50 μM cycloheximide (CHX) in the presence or absence of 100 nM BafA1. Cells were collected at indicated time points and protein expression was analyzed by WB. The levels of GP in A, B, C, D, and E were further quantified. Error bars represent SEMs calculated from three independent experiments. *p < 0.05, **p < 0.01, ***p < 0.001, ****p < 0.0001, ns (p > 0.05).](/cms/asset/8a592751-9cad-4f74-8e73-e3ed2934c662/kaup_a_2031381_f0006_oc.jpg)
Figure 7. Specificity of the PDIA3 inhibitory activity on viral glycoprotein expression. (a) HEK293T cells were transfected with a control (Ctrl) vector, or vectors expressing MARV-GP, EBOV-GP, and/or PDIA3. After 48 h, cells were incubated with WST-8 and viable cells were counted by a microplate reader with a 450 nm filter. Results are presented as optical density (OD450). (b) HEK293T cells were transfected with increasing amounts of MARV-GP with a HiBiT-tag and 1.0 μg PDIA3 expression vectors. The GP expression was determined by Nano-Glo® HiBiT Blotting System. (c) MARV-GP expression in B was further quantified by Nano-Glo® HiBiT Lytic Reagent and are presented relative luminescence units (RLU). (d) MARV-GP was expressed in HEK293T WT and PDIA3-KO cells, and its expression was determined by the HiBiT Blotting system. (e) GPs from indicated ebolaviruses were expressed with PDIA3 in HEK293T cells. Alternatively, they were expressed in HEK293T WT and PDIA3-KO cells. GP expression was determined by WB using anti-EBOV-GP. (f) Indicated viral glycoproteins were expressed with PDIA3 in HEK293T cells. Alternatively, they were expressed in HEK293T WT and PDIA3-KO cells. Their expression was analyzed by WB using their specific antibodies. (g) HIV-1 firefly luciferase reporter viruses with authentic HIV-1 Env or pseudotyped with EBOV-GP, MARV-GP, or VSV-G were produced from HEK293T cells in the presence of ectopic PDIA3. The entry of viruses with HIV-1 Env was determined in TZM-bI cells, and that of pseudoviruses was determined in HEK293T cells. Viral entry is shown as relative values, with the value in the absence of PDIA3 normalized to 100%. The levels of GP in D and E were further quantified. Error bars in A, C, D, and G represent SEMs calculated from three independent experiments. *p < 0.05, **p < 0.01, ***p < 0.001, ****p < 0.0001, ns (p > 0.05).
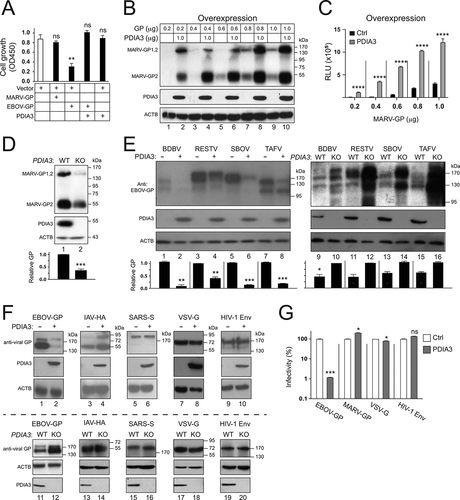
Figure 8. Broadness of the PDIA3 inhibitory activity. (a) GP and PDIA3 were expressed in A549 cells, HeLa cells, Hep G2 cells, THP1-derived macrophages (THP1-Mϕ), and primary mouse macrophages (Mϕ), and their expression was detected by WB. (b) Schematic diagrams of eight PDI family members are shown. TLDs (a, a’, b, and b’) are shown in blue, green, purple, or Orange, respectively. An ER retention sequence is shown in purple. The canonical CGHC or its similar motifs in TRX-like domains are indicated. (c) GP and GP∆MLD were expressed with indicated eight PDI family members in HEK293T cells and their expression was analyzed by WB. The levels of GP in A and C were further quantified. Error bars in A and C represent SEMs calculated from three independent experiments. *p < 0.05, **p < 0.01, ***p < 0.001, ****p < 0.0001, ns (p > 0.05).
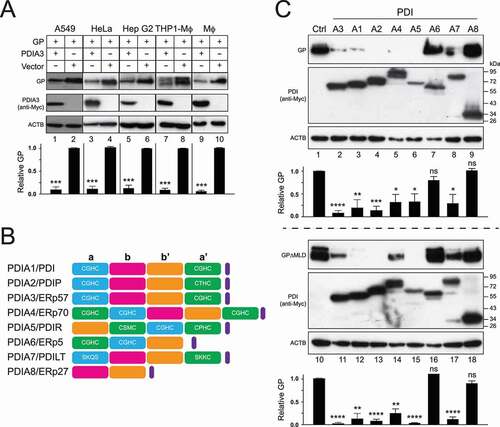
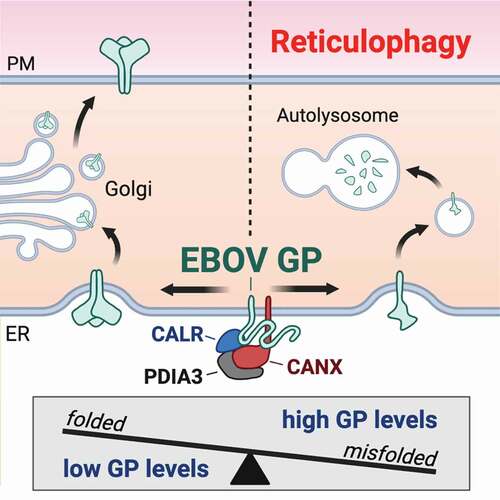
Figure 9. A model of how protein-folding machinery regulates EBOV-GP expression in the ER. PDIA3 interacts with CANX and CALR, which comprises the CANX-CALR cycle in the ER that promotes N-glycosylated protein folding. However, this protein-folding machinery acts as a double-edged sword during EBOV infection. It can increase the GP expression by promoting its folding for viral infection. Alternatively, it also decreases the GP expression by degradation via reticulophagy for cell survival. Thus, PDIA3 increases the viral fitness by tightly controlling the levels of GP expression during ebolavirus infection.
