725
Views
1
CrossRef citations to date
0
Altmetric
Brief Report

Bidirectional roles of the Ccr4-Not complex in regulating autophagy before and after nitrogen starvation

, , & ORCID Icon
Pages 415-425 | Received 01 Oct 2021, Accepted 28 Jan 2022, Published online: 15 Feb 2022

Figures & data

Figure 1. Ccr4-Not is a post-transcriptional repressor of autophagy during growing conditions. (A) WT, ccr4∆ and pan2∆ cells were grown in YPD until mid-log phase. Total RNA was extracted, and the mRNA levels were quantified by RT-qPCR. The mRNA levels of individual ATG genes were normalized to WT cells (set to 1). Mean ± SEM, n ≥ 3 independent experiments. Student’s t-test; *p < 0.05, **p < 0.01, ****p < 0.0001. (B) Ccr4-AID cells were grown in YPD to mid-log phase and treated with either DMSO or 300 μM IAA for 1 and 3 h. Cell lysates were prepared at different time points, and the level of Ccr4-AID-9MYC was analyzed by western blot with anti-MYC antibody. (C) Ccr4-AID cells were grown in YPD to early log phase and treated with either DMSO or 300 μM IAA for 3 h. The mRNA levels of individual ATG genes were quantified by RT-qPCR and normalized to the DMSO treatment group (set to 1). Mean ± SEM, n = 3 independent experiments. Student’s t-test; **p < 0.01, ***p < 0.001, ****p < 0.0001. (D) Atg1, Atg7-PA, and Atg9 protein levels were measured by western blot in WT and ccr4∆ strains under growing conditions and after 1 and 3 h of nitrogen starvation; representative images are shown. (E) WT and pop2∆ cells were grown in YPD until mid-log phase. The mRNA levels were quantified and shown as in Figure 1A. Student’s t-test; *p < 0.05, **p < 0.01, ****p < 0.0001.
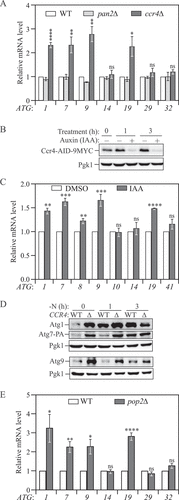
Figure 1. Ccr4-Not is a post-transcriptional repressor of autophagy during growing conditions. (A) WT, ccr4∆ and pan2∆ cells were grown in YPD until mid-log phase. Total RNA was extracted, and the mRNA levels were quantified by RT-qPCR. The mRNA levels of individual ATG genes were normalized to WT cells (set to 1). Mean ± SEM, n ≥ 3 independent experiments. Student’s t-test; *p < 0.05, **p < 0.01, ****p < 0.0001. (B) Ccr4-AID cells were grown in YPD to mid-log phase and treated with either DMSO or 300 μM IAA for 1 and 3 h. Cell lysates were prepared at different time points, and the level of Ccr4-AID-9MYC was analyzed by western blot with anti-MYC antibody. (C) Ccr4-AID cells were grown in YPD to early log phase and treated with either DMSO or 300 μM IAA for 3 h. The mRNA levels of individual ATG genes were quantified by RT-qPCR and normalized to the DMSO treatment group (set to 1). Mean ± SEM, n = 3 independent experiments. Student’s t-test; **p < 0.01, ***p < 0.001, ****p < 0.0001. (D) Atg1, Atg7-PA, and Atg9 protein levels were measured by western blot in WT and ccr4∆ strains under growing conditions and after 1 and 3 h of nitrogen starvation; representative images are shown. (E) WT and pop2∆ cells were grown in YPD until mid-log phase. The mRNA levels were quantified and shown as in Figure 1A. Student’s t-test; *p < 0.05, **p < 0.01, ****p < 0.0001.

Figure 2. The Ccr4-Not complex acts to downregulate autophagy under basal conditions. (A) WT and different clones of ccr4∆ cells with an integration plasmid expressing CUP1 promoter-driven GFP-ATG8 were grown to mid-log phase in YPD (-N, 0 h) and shifted to SD-N for the indicated times. Autophagy activity was measured using the GFP-Atg8 processing assay. ∆1 and ∆2 indicate two independent deletion colonies. The ratio of free GFP to total GFP (free GFP plus GFP-Atg8) was quantified. Mean ± SEM of n ≥ 3 independent experiments are indicated. Student’s t-test; *p < 0.05, **p < 0.01. (B) WT and pop2∆ cells with an integration plasmid expressing CUP1 promoter-driven GFP-ATG8 were grown to mid-log phase in YPD (-N, 0 h) and shifted to SD-N for the indicated times. Autophagy activity was measured using the GFP-Atg8 processing assay. (C) Ccr4-AID cells expressing a CUP1 promoter-driven GFP-ATG8 plasmid were grown to mid-log phase in YPD, diluted to OD600 = 0.005, treated with either DMSO or 300 μM IAA and grown for an additional 6 h, allowing the cultures reach mid-log phase. Autophagy activity was measured using the GFP-Atg8 processing assay. (D) WT (WLY176, Ccr4-AID) cells were grown to mid-log phase in YPD, diluted, then treated with either DMSO or 300 μM IAA for 3 and 8 h. Autophagy activity was monitored by the Pho8∆60 assay. Pho8∆60 activity was normalized to the sample with 8 h of DMSO treatment (set to 100%). Mean ± SEM of n ≥ 3 independent experiments are indicated. Student’s t-test; *p < 0.05, ***p < 0.001. (E) Ccr4-AID cells were grown to early-log phase (OD600 = 0.1) in YPD for over 15 doublings and treated with either DMSO or 300 μM IAA for 3 h. Autophagy activity was measured with the prApe1 processing assay using anti-Ape1 antiserum. Representative images and quantification of the data are shown. Mean ± SEM, n = 3 independent experiments. Student’s t-test; *p < 0.05.
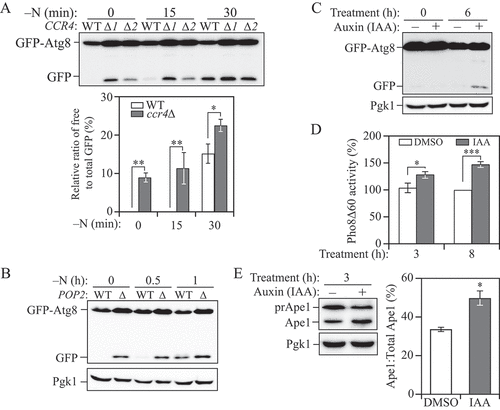
Figure 2. The Ccr4-Not complex acts to downregulate autophagy under basal conditions. (A) WT and different clones of ccr4∆ cells with an integration plasmid expressing CUP1 promoter-driven GFP-ATG8 were grown to mid-log phase in YPD (-N, 0 h) and shifted to SD-N for the indicated times. Autophagy activity was measured using the GFP-Atg8 processing assay. ∆1 and ∆2 indicate two independent deletion colonies. The ratio of free GFP to total GFP (free GFP plus GFP-Atg8) was quantified. Mean ± SEM of n ≥ 3 independent experiments are indicated. Student’s t-test; *p < 0.05, **p < 0.01. (B) WT and pop2∆ cells with an integration plasmid expressing CUP1 promoter-driven GFP-ATG8 were grown to mid-log phase in YPD (-N, 0 h) and shifted to SD-N for the indicated times. Autophagy activity was measured using the GFP-Atg8 processing assay. (C) Ccr4-AID cells expressing a CUP1 promoter-driven GFP-ATG8 plasmid were grown to mid-log phase in YPD, diluted to OD600 = 0.005, treated with either DMSO or 300 μM IAA and grown for an additional 6 h, allowing the cultures reach mid-log phase. Autophagy activity was measured using the GFP-Atg8 processing assay. (D) WT (WLY176, Ccr4-AID) cells were grown to mid-log phase in YPD, diluted, then treated with either DMSO or 300 μM IAA for 3 and 8 h. Autophagy activity was monitored by the Pho8∆60 assay. Pho8∆60 activity was normalized to the sample with 8 h of DMSO treatment (set to 100%). Mean ± SEM of n ≥ 3 independent experiments are indicated. Student’s t-test; *p < 0.05, ***p < 0.001. (E) Ccr4-AID cells were grown to early-log phase (OD600 = 0.1) in YPD for over 15 doublings and treated with either DMSO or 300 μM IAA for 3 h. Autophagy activity was measured with the prApe1 processing assay using anti-Ape1 antiserum. Representative images and quantification of the data are shown. Mean ± SEM, n = 3 independent experiments. Student’s t-test; *p < 0.05.

Figure 3. Ccr4-Not binds to ATG mRNAs and negatively regulates their stability in growing conditions. (A) WT and CCR4-PA cells were grown in YPD medium to mid-log phase (+N) and then shifted to SD-N for 2 h (-N). Cells were subjected to RNA immunoprecipitation as described in Materials and Methods. qRT-PCR experiments were performed to show the enrichment of ATG mRNAs based on the Ccr4-PA RIP assay. Mean ratios ± SEM of n = 3 independent experiments of ATG mRNA levels in Ccr4-PA:non-tag RIP are indicated. PGK1 mRNA served as a negative control. Student’s t-test, *p < 0.05, ns, not significant. (B and C) WT and ccr4∆ cells were grown in YPD medium until mid-log phase, and then (B) treated with 200 µg/ml 1,10-phenanthroline for 50 and 100 min, or (C) shifted to SD-N for 50 and 100 min in the presence of 200 µg/ml 1,10-phenanthroline. The mRNA levels of individual ATG genes were first normalized to the reference gene SCR1 and then normalized to WT cells with no treatment (set to 1). Mean ± SEM, n ≥ 3 independent experiments. Student’s t-test; *p < 0.05, **p < 0.01, ns, not significant. (D) WT (CCR4-PA) and the indicated Ccr4 catalytic mutant cells were grown in YPD until mid-log phase. The mRNA levels of individual ATG genes were measured, quantified, and shown as in . Student’s t-test; **p < 0.01, ***p < 0.001.
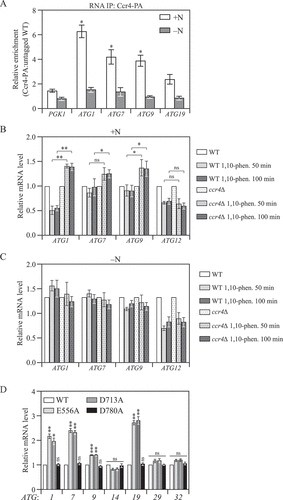
Figure 3. Ccr4-Not binds to ATG mRNAs and negatively regulates their stability in growing conditions. (A) WT and CCR4-PA cells were grown in YPD medium to mid-log phase (+N) and then shifted to SD-N for 2 h (-N). Cells were subjected to RNA immunoprecipitation as described in Materials and Methods. qRT-PCR experiments were performed to show the enrichment of ATG mRNAs based on the Ccr4-PA RIP assay. Mean ratios ± SEM of n = 3 independent experiments of ATG mRNA levels in Ccr4-PA:non-tag RIP are indicated. PGK1 mRNA served as a negative control. Student’s t-test, *p < 0.05, ns, not significant. (B and C) WT and ccr4∆ cells were grown in YPD medium until mid-log phase, and then (B) treated with 200 µg/ml 1,10-phenanthroline for 50 and 100 min, or (C) shifted to SD-N for 50 and 100 min in the presence of 200 µg/ml 1,10-phenanthroline. The mRNA levels of individual ATG genes were first normalized to the reference gene SCR1 and then normalized to WT cells with no treatment (set to 1). Mean ± SEM, n ≥ 3 independent experiments. Student’s t-test; *p < 0.05, **p < 0.01, ns, not significant. (D) WT (CCR4-PA) and the indicated Ccr4 catalytic mutant cells were grown in YPD until mid-log phase. The mRNA levels of individual ATG genes were measured, quantified, and shown as in Figure 1A. Student’s t-test; **p < 0.01, ***p < 0.001.

Figure 4. Ccr4-Not is required for sufficient autophagy under nitrogen-starvation conditions. (A) WT and ccr4∆ cells were grown in YPD until mid-log phase, and then starved for nitrogen for 2 h. The mRNA levels were quantified and shown as in . Mean ± SEM, n ≥ 3 independent experiments. Student’s t-test; *p < 0.05, **p < 0.01, ****p < 0.0001, ns, not significant. (B) Ccr4-AID cells were grown in YPD to mid-log phase and pre-treated with either DMSO or 300 μM IAA for 30 min, then they were shifted to SD-N for 1 h in the presence of either DMSO or IAA. The mRNA levels of individual ATG genes were quantified by RT-qPCR and normalized to the DMSO treatment group (set to 1). Mean ± SEM, n = 4 independent experiments. Student’s t-test; **p < 0.01, ***p < 0.001, ns, not significant. (C) Ccr4-AID cells were grown in YPD medium to mid-log phase and pre-treated with either DMSO or 300 μM IAA for 30 min (-N, 0 h), then they were shifted to SD-N for the indicated times in the presence of either DMSO or IAA. Atg1, Atg8, and Atg9-PA protein levels were measured by western blot; representative images are shown. (D and E) WT and ccr4∆ cells in which either PGI1 or FBA1 was chromosomally tagged with GFP were grown in YPD to mid-log phase (-N, 0 h) and shifted to SD-N for the indicated times. Autophagy activity was measured by the (D) Pgi1-GFP processing assay or (E) Fba1-GFP processing assay; representative images are shown. (F) Ccr4-AID Pgi1-GFP cells were grown in YPD to mid-log phase and pre-treated with either DMSO or 300 μM IAA for 30 min (-N, 0 h), then they were shifted to SD-N for the indicated times in the presence of either DMSO or IAA. Autophagy activity was measured by the Pgi1-GFP processing assay; a representative image is shown. (G) WT and ccr4∆ cells were grown in YPD to mid-log phase and then shifted to SD-N for the indicated times. The indicated dilutions were grown on YPD plates for 3 days.
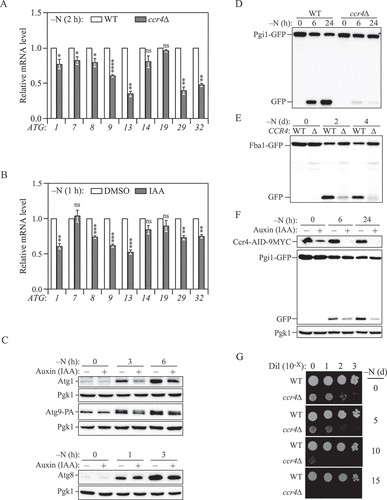
Figure 4. Ccr4-Not is required for sufficient autophagy under nitrogen-starvation conditions. (A) WT and ccr4∆ cells were grown in YPD until mid-log phase, and then starved for nitrogen for 2 h. The mRNA levels were quantified and shown as in Figure 1A. Mean ± SEM, n ≥ 3 independent experiments. Student’s t-test; *p < 0.05, **p < 0.01, ****p < 0.0001, ns, not significant. (B) Ccr4-AID cells were grown in YPD to mid-log phase and pre-treated with either DMSO or 300 μM IAA for 30 min, then they were shifted to SD-N for 1 h in the presence of either DMSO or IAA. The mRNA levels of individual ATG genes were quantified by RT-qPCR and normalized to the DMSO treatment group (set to 1). Mean ± SEM, n = 4 independent experiments. Student’s t-test; **p < 0.01, ***p < 0.001, ns, not significant. (C) Ccr4-AID cells were grown in YPD medium to mid-log phase and pre-treated with either DMSO or 300 μM IAA for 30 min (-N, 0 h), then they were shifted to SD-N for the indicated times in the presence of either DMSO or IAA. Atg1, Atg8, and Atg9-PA protein levels were measured by western blot; representative images are shown. (D and E) WT and ccr4∆ cells in which either PGI1 or FBA1 was chromosomally tagged with GFP were grown in YPD to mid-log phase (-N, 0 h) and shifted to SD-N for the indicated times. Autophagy activity was measured by the (D) Pgi1-GFP processing assay or (E) Fba1-GFP processing assay; representative images are shown. (F) Ccr4-AID Pgi1-GFP cells were grown in YPD to mid-log phase and pre-treated with either DMSO or 300 μM IAA for 30 min (-N, 0 h), then they were shifted to SD-N for the indicated times in the presence of either DMSO or IAA. Autophagy activity was measured by the Pgi1-GFP processing assay; a representative image is shown. (G) WT and ccr4∆ cells were grown in YPD to mid-log phase and then shifted to SD-N for the indicated times. The indicated dilutions were grown on YPD plates for 3 days.
Supplemental material

Supplemental Material

Download MS Word (884.1 KB)

Reprints and Corporate Permissions

Please note: Selecting permissions does not provide access to the full text of the article, please see our help page How do I view content?

To request a reprint or corporate permissions for this article, please click on the relevant link below:

Academic Permissions

Please note: Selecting permissions does not provide access to the full text of the article, please see our help page How do I view content?

Obtain permissions instantly via Rightslink by clicking on the button below:

If you are unable to obtain permissions via Rightslink, please complete and submit this Permissions form. For more information, please visit our Permissions help page.