
Figures & data
Figure 1. Chloroquine does not substantially affect physical properties of secreted particles. (A) Immunoblot characterization of secreted particles from three cell lines. Protein concentrations of whole cell lysates (WC) and secreted (SE) fractions were quantified using a BCA assay. equal amount of protein was loaded in each lane. Samples from the same experiments were run in parallel blots. Known sEV proteins TSG101, SDCBP/syntenin-1, CD9, and CD63 were analyzed along with known sEV-associated proteins, HSP90AA1 and LAMP2, and the ER marker ERN1/IRE1a. (B) Transmission electron micrograph visualization of sEV contained in the secreted fraction, using uranyl acetate as a counter stain. Scale bar: 200 nm. (C) Total protein content (measured by BCA assay) and particle count (measured by nanoparticle tracking analysis [NTA]) of secreted particles normalized to cell number. significance was determined by paired t-test (**: p < 0.01; n = 3). Horizontal lines denote mean and SD. (D) Size distribution of secreted particles measured by NTA. Solid lines represent mean while dotted lines represent SD (n = 3). (E) Effect of CQ on modal or mean size of secreted particles, or particle/protein ratio. Error bars represent SD. Significance was determined by paired t-test (n = 3).
![Figure 1. Chloroquine does not substantially affect physical properties of secreted particles. (A) Immunoblot characterization of secreted particles from three cell lines. Protein concentrations of whole cell lysates (WC) and secreted (SE) fractions were quantified using a BCA assay. equal amount of protein was loaded in each lane. Samples from the same experiments were run in parallel blots. Known sEV proteins TSG101, SDCBP/syntenin-1, CD9, and CD63 were analyzed along with known sEV-associated proteins, HSP90AA1 and LAMP2, and the ER marker ERN1/IRE1a. (B) Transmission electron micrograph visualization of sEV contained in the secreted fraction, using uranyl acetate as a counter stain. Scale bar: 200 nm. (C) Total protein content (measured by BCA assay) and particle count (measured by nanoparticle tracking analysis [NTA]) of secreted particles normalized to cell number. significance was determined by paired t-test (**: p < 0.01; n = 3). Horizontal lines denote mean and SD. (D) Size distribution of secreted particles measured by NTA. Solid lines represent mean while dotted lines represent SD (n = 3). (E) Effect of CQ on modal or mean size of secreted particles, or particle/protein ratio. Error bars represent SD. Significance was determined by paired t-test (n = 3).](/cms/asset/7b7b551f-0d4a-4f65-8347-353f10b5088e/kaup_a_2039535_f0001_oc.jpg)
Figure 2. Chloroquine treatment alters the MDA-MB-213 secretome. (A) All proteins identified from the secreted fraction were used in gene ontology (GO) enrichment analysis to identify enriched cellular components terms relative to the total proteome identified from WC fractions. The top 10 enriched and de-enriched GO terms are shown, and all passed a significance threshold of adjusted p-value < 0.05. See also Table S1, S2. (B) CQ-induced differential protein abundance in the secretome of MDA-MB-231. 189 proteins (4.4% of 4302 identified proteins) were differentially abundant between secretomes of control and CQ-treated MDA-MB-231 cells (solid dots). Threshold for defining significance was set at an adjusted p-value of 0.05 (horizontal dotted line) and an absolute log2-fold change of 0.584 (1.5-fold change, vertical lines). See also Fig. S2D. (C) CQ-induced differential protein abundance in whole cell (WC) lysate of MDA-MB-231. 178 proteins (2.1% of 8512 identified proteins) were differentially abundant between control and CQ-treated MDA-MB-231 cells (solid dots). Threshold for defining significance was set at an adjusted p-value of 0.05 (horizontal dotted line) and an absolute log2-fold change of 0.584 (1.5-fold change, vertical lines). See also Fig. S2C. (D) Bubble chart showing KEGG pathway analysis results of proteins differentially abundant due to CQ treatment. Only the top 20 enriched pathways with adjusted p-value < 0.2 in each condition are shown and are listed on the y-axis. Samples and directionality of the protein fold-changes are represented on the X-axis. Size and color of the bubbles represent proportion of differentially abundant proteins in pathway and their significance, respectively. (E) CQ-induced protein fold changes (log2-scale; Log2FC) in whole cell (WC; X-axis) vs in secreted fraction (SE; Y-axis) are shown as a scatter plot where each dot represents a protein identified in the proteome of both WC and SE. Threshold for defining significance was set at an adjusted p-value of 0.05 and an absolute log2-fold change of 0.584 (1.5-fold change, dotted rectangle). Proteins meeting the fold-change cutoff in both WC and SE datasets are shown as large opaque dots, whereas proteins meeting the cutoff in only one dataset are shown as semi-transparent dots. Each dot is colored according to its direction of fold change in both WC and SE. Proteins of interest, including mammalian Atg8-family orthologs and select autophagy cargo receptors, are labeled. +CQ: CQ-treated; -CQ: not treated. See also , S2 and Fig. S2E, S2F, S2G.
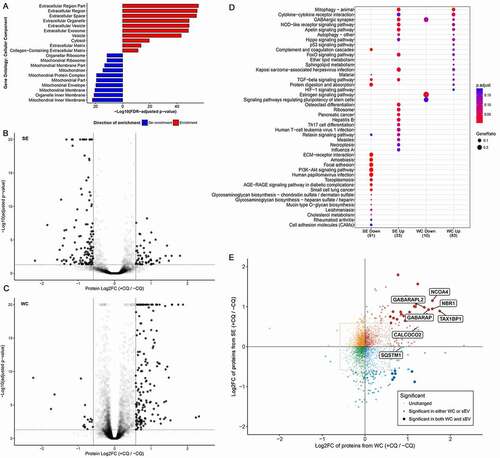
Figure 3. Chloroquine enhances secretion of TAX1BP1 in an ATG16L1-dependent manner. (A) Whole cell pellet collected alongside the secreted fraction were lysed and probed for TAX1BP1, GABARAP, and LC3B. Significance was determined by paired t-test (*: p < 0.05; **: p < 0.01; n = 3). ±: plus or minus 10 µM CQ. (B) Secreted particles (SE) were collected from cells treated with or without 10 µM CQ and probed for TAX1BP1, TSG101, GABARAP and LC3B. Equal amount of protein, as determined by BCA assay, was loaded in each lane. (C) CRISPR-mediated knockout (KO) of ATG16L1 with two different single guide RNAs was used to generate isogenic ATG16L1 KO lines in MDA-MB-231 (n = 3). Secreted particles were collected as described and probed for LC3B, TSG101 and TAX1BP1. (D) Isogenic ATG4B KO cells were generated using CRISPR-mediated knockout (KO). Secreted particles were collected from ATG4B KO cells in the presence or absence of 10 µM CQ treatment and probed for LC3B and GABARAPL2 (n = 3). (E) The effect of ATG16L1 knockout and rescue on the lipidation of LC3B and GABARAP in whole cell (WC) and secretion (SE) of LC3B and TAX1BP1 (n = 3). Samples from the same experiment were run on parallel blots. WT: wild type; -: ATG16L1 KO, α: ATG16L1-α rescue of ATG16L1 KO; β: ATG16L1-β rescue of ATG16L1 KO. (F) Densitometry quantitation of SE fraction in (E). Significance was determined by one-way ANOVA with Sidak’s multiple comparison test (***: p < 0.001; **: p < 0.01; *: p < 0.05; ns: not significant; n = 3).
Figure 4. CQ induces accumulation of Atg8-family orthologs inside sEV of MDA-MB-231 cells. (A) Equal volume of secreted fraction collected from control and 10 µM CQ-treated MDA-MB-231 cells were treated with PBS, 50 µg/ml trypsin, or 50 µg/ml trypsin plus 1% Triton X-100 (TX-100). Positive controls for proteins inside sEV are TSG101 and SDCBP/syntenin-1. (B) Densitometry quantitation of trypsin-resistant SDCBP/syntenin-1, lipidated LC3B (LC3B-II), GABARAP, and GABARAPL2 levels normalized to TSG101. Significance was determined by paired ratio t-test (*: p < 0.05, n = 3). Error bars represent SD.
Figure 5. Chloroquine enlarges endosomes and induces co-localization of autophagy-related protein with endolysosomal markers. (A) SUM159PT cells were grown on cover glasses and treated with vehicle or 10 µM CQ. After 48 h, cells were fixed with cold methanol and incubated with anti-LC3B and anti-CD63 antibodies followed by corresponding secondary antibodies for confocal microscopy. Scale bars: 50 µm. (B) Endosome diameter was measured for n = 150 endosomes from control and CQ-treated cells, where significance was determined by two-tailed t-test (****: p < 0.001). (C) Pearson’s correlation coefficient (PCC) between CD63 and LC3B was determined for n = 11 individual cells treated with vehicle or CQ, where significance was calculated by two-tailed t-test (****: p < 0.001). (D) – (F) MDA-MB-231 cells stably expressing CD63-GFP were grown on cover glasses in full media. After 48 h of 10 µM CQ treatment, cells were fixed and immunostained as indicated for confocal microscopy. To determine co-localization, the intensity profile along a line in a single z-section (as indicated in the boxed region) was measure for each channel (except DAPI) and compared, where overlap was interpreted as co-localization. Scale bars: 20 µm.
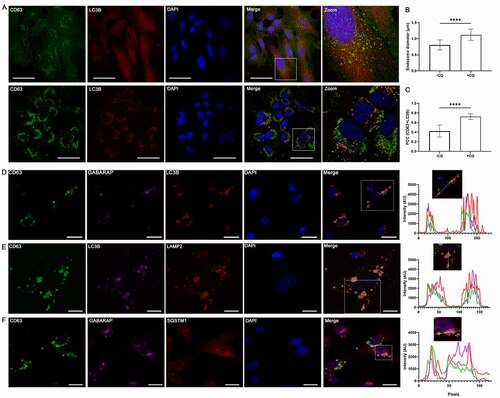
Figure 6. Atg8 orthologs are enriched in specific subsets of sEV. (A) Centrifugation density gradient (6% to 30% iodixanol) fractionation of ultrafiltration-concentrated conditioned media from 10 µM CQ treated MDA-MB-231 cells (n = 2). (B) Using anti-CD63 or anti-CD9 antibody-bound magnetic beads, immunoaffinity capture was conducted on pre-cleared and concentrated conditioned media of CQ-treated MDA-MB-231 cells (n = 3). (C) Densitometry quantitation of LC3B and GABARAP levels in CD63-IP were normalized to TSG101 levels in the respective lane. Significance was determined by paired t-test (*: p < 0.05; n = 3). Error bars represent SD. (D) Conditioned media from CQ-treated MDA-MB-231 ATG16L1 KO cells expressing either ATG16L1-α or ATG16L1-β was pre-cleared, concentrated, and incubated with CD63-Dynabeads overnight at 4°C. Beads were washed twice the next day and eluded by boiling in 1X LDS with reducing agent (n = 3). (E) Centrifugation density gradient (6% to 30% iodixanol) fractionation of ultrafiltration-concentrated conditioned media from 10 µM CQ treated MDA-MB-231 ATG16L1 KO cells rescued with either ATG16L1-α or ATG16L1-β (n = 2). (F) Secreted particles (SE) were collected from ATG16L1 KO cells rescued with truncated ATG16L1 (aa 1–249) treated with control or 10 µM CQ. Significance was determined by paired t-test (*: p < 0.05; n = 3). Error bars represent SD. (G) Using anti-CD63 antibody-bound magnetic beads, immunoaffinity capture was conducted on pre-cleared and concentrated conditioned media of CQ treated ATG16L1 KO cells expressing ATG16L1(1–249) (n = 3). (H) Centrifugation density gradient (6% to 30% iodixanol) fractionation of ultrafiltration-concentrated conditioned media from 10 µM CQ treated MDA-MB-231 ATG16L1 KO cells rescued with ATG16L1 (aa1-249) (n = 2). (I) Centrifugation density gradient (6% to 30% iodixanol) fractionation of ultrafiltration-concentrated conditioned media from 10 µM CQ treated MDA-MB-231 ULK1 KO cells (n = 2).
Table 1. Key reagents.