
Figures & data
Figure 1. The phylogenetic relationship, domain structure comparison and tissue gene expression of ATG16L1 and ATG16L2. (A) The phylogenetic relationship of ATG16L1 and ATG16L2 sequences in selected species from UniProt. The maximum likelihood tree was constructed using Mega X and illustrates two distinct ATG16L branches corresponding to ATG16L1 (blue) and ATG16L2 (green). Bootstrap values are shown. UniProt identifiers are shown in brackets. (B) Comparison of the domain structures in human ATG16L1 and ATG16L2. The UniProt canonical isoform for each protein (ATG16L1β and ATG16L2β) is depicted with the major domains and SNPs highlighted. The three ATG16L regions (N, M and C) are shown. Known domains and interaction sites are highlighted in colored blocks (coiled coil, yellow; ATG5 binding site, green; RB1CC1, blue; and WIPI2, magenta). ATG16L1 and RAB33B interact with ATG16L1 and L2 in the M-region as shown. ATG16L2 rs11235604 (R220W) and ATG16L1 rs2241880 (T300A) are displayed in red. (C) Heatmap illustrating the expression of ATG16L1 and ATG16L2 in different tissues. The color indicates the relative expression, in transcripts per million (TPM), of ATG16L1 and ATG16L2. The gene expression data shown in this manuscript were obtained from the Genotype-Tissue Expression (GTEx) Multi gene query[Citation31] on 31/08/2021.
![Figure 1. The phylogenetic relationship, domain structure comparison and tissue gene expression of ATG16L1 and ATG16L2. (A) The phylogenetic relationship of ATG16L1 and ATG16L2 sequences in selected species from UniProt. The maximum likelihood tree was constructed using Mega X and illustrates two distinct ATG16L branches corresponding to ATG16L1 (blue) and ATG16L2 (green). Bootstrap values are shown. UniProt identifiers are shown in brackets. (B) Comparison of the domain structures in human ATG16L1 and ATG16L2. The UniProt canonical isoform for each protein (ATG16L1β and ATG16L2β) is depicted with the major domains and SNPs highlighted. The three ATG16L regions (N, M and C) are shown. Known domains and interaction sites are highlighted in colored blocks (coiled coil, yellow; ATG5 binding site, green; RB1CC1, blue; and WIPI2, magenta). ATG16L1 and RAB33B interact with ATG16L1 and L2 in the M-region as shown. ATG16L2 rs11235604 (R220W) and ATG16L1 rs2241880 (T300A) are displayed in red. (C) Heatmap illustrating the expression of ATG16L1 and ATG16L2 in different tissues. The color indicates the relative expression, in transcripts per million (TPM), of ATG16L1 and ATG16L2. The gene expression data shown in this manuscript were obtained from the Genotype-Tissue Expression (GTEx) Multi gene query[Citation31] on 31/08/2021.](/cms/asset/fa4c57e0-a39a-4c49-b466-e13bbd84e908/kaup_a_2042783_f0001_oc.jpg)
Figure 2. Schematic overview summarizing the role of ATG16L1 and ATG16L2 in autophagy. (A) ATG16L1 (purple circle) complexes with ATG12–ATG5 (red and blue circles, respectively), leads to LC3 lipidation and autophagosome formation. (B) Effect of ATG16L2 overexpression. ATG16L2 (orange circle) is a putative dominant negative inhibitor of ATG16L1, therefore, ATG16L2 competes with ATG16L1 to bind with ATG12–ATG5 complexes. ATG16L2 lacks WIPI2 and RB1CC1 interaction sites, hence ATG12–ATG5-ATG16L2 complexes are not recruited to the phagophore membrane resulting in reduced LC3 lipidation and autophagy.
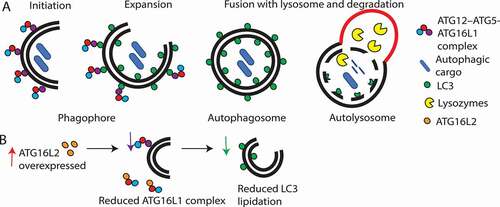
Table 1. ATG16L2 SNPs implicated in human disease
Table 2. ATG16L2 SNPs associated with cancer and efficacy of cancer treatments
Figure 3. Heat map illustrating significant upregulation or downregulation of ATG16L2 reported in different cancer and neurodegenerative diseases from published studies and/or Gene expression profiling interactive analysis (GEPIA) [Citation84]. Color is indicative of significant upregulation (red) or downregulation (blue) not the magnitude of the fold-change. For the specified cancers and neurodegenerative diseases, no significant differences in ATG16L1 expression were reported in the published studies and/or GEPIA.
![Figure 3. Heat map illustrating significant upregulation or downregulation of ATG16L2 reported in different cancer and neurodegenerative diseases from published studies and/or Gene expression profiling interactive analysis (GEPIA) [Citation84]. Color is indicative of significant upregulation (red) or downregulation (blue) not the magnitude of the fold-change. For the specified cancers and neurodegenerative diseases, no significant differences in ATG16L1 expression were reported in the published studies and/or GEPIA.](/cms/asset/5598b57d-5b43-4c11-98db-1022459c60b3/kaup_a_2042783_f0003_oc.jpg)