Figures & data
Figure 1. Mechanical injury has both promotional and inhibitory effects on autophagy in the C. elegans epidermis. (A) Representative confocal images showing the distribution patterns of GFP::LGG-1 driven by the epidermal-specific Pdpy-7 promoter in the adults with an intact epidermis (control), a single wound or multiple wounds created by needle puncture. (B) Quantification of the number of GFP::LGG-1 puncta per unit area in the anterior or posterior part of the epidermis in wounded animals compared with control, corresponding to results in (A). n ≥ 6 per condition. (C) Representative confocal images showing the distribution patterns of GFP::LGG-1 driven by the epidermal-specific Pdpy-7 promoter in adult animals subjected to heat shock treatment with or without multiple needle wounding. (D) Quantification of the number of GFP::LGG-1 puncta per unit area in the anterior or posterior part of the epidermis with indicated treatments, corresponding to results in (C). n ≥ 8 per condition. Arrows point to sites of wounding. Scale bars: 40 μm. Error bars represent mean ± SEM. ns, not significant; *, P < 0.05; ***, P < 0.001; ****, P < 0.0001 (two-tailed, unpaired t-test).
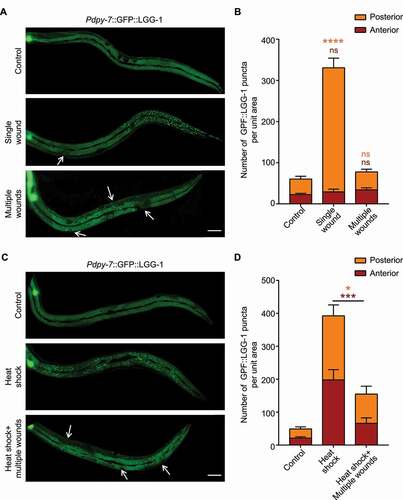
Figure 2. Structural damage at the basal side of the epidermis increases the autophagic response. (A) Representative confocal images showing the distribution patterns of GFP::LGG-1 driven by the epidermal-specific Pdpy-7 promoter in the young adults with intact (control) or damaged struts (bli-1), apical CeHDs (mup-4), the plakin cytolinker (vab-10a), cytoskeletons (ifb-1, cytochalasin D and nocodazole), basal CeHDs (let-805), basal ECM (unc-52) or adjacent muscle quadrants (unc-112). Scale bar: 10 μm. (B) Quantification of results in (A) showing the number of GFP::LGG-1 puncta per unit area in the epidermis of worms after disruption of various epidermal supporting structures compared with control. n ≥ 8 per condition. (C) Western blot analysis of the protein levels of LGG-1-I (unlipidated form) and LGG-1-II (lipidated form) in wild-type animals treated with the empty vector L4440 (control), mup-4 RNAi, or unc-52 RNAi. Tubulin serves as the loading control. (D) Representative confocal images showing the distribution patterns of GFP::LGG-1 driven by its own promoter in the epidermis of wild-type (WT) or epg-5(tm3425) young adults treated with L4440 (control) or unc-52 RNAi. Scale bar: 10 μm. (E) Quantification of the number of GFP::LGG-1 puncta per unit area in the epidermis of animals with the indicated genotypes, corresponding to results in (D). n ≥ 10 per condition. (F) Western blot analysis of the protein levels of SQST-1::GFP driven by the epidermal-specific promoter Pcol-19 in the adults treated with L4440 (control), unc-52 RNAi or let-363 RNAi (positive control). Co-injected Pmyo-2::GFP serves as the internal control. (G) Representative confocal images showing the protein levels of SQST-1::GFP in L4440 (control), unc-52 RNAi or let-363 RNAi-treated animals. Scale bar: 40 μm. Error bars represent mean ± SEM. ***, P < 0.001; ****, P < 0.0001 (two-tailed, unpaired t-test).
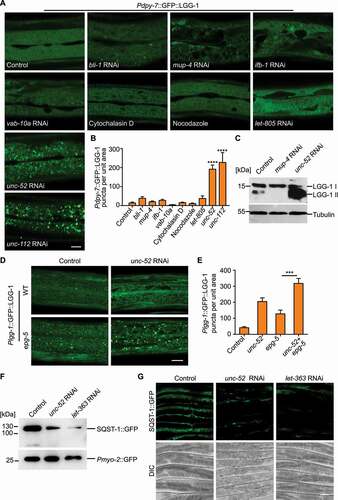
Figure 3. Apical epidermal structural damage inhibits autophagy activation. (A) Representative confocal images showing the distribution patterns of GFP::LGG-1 driven by the epidermal-specific Pdpy-7 promoter in sham-treated adults fed with bacteria carrying the empty vector L4440 (control), heat shock (HS) or paraquat-treated adults fed with L4440, mup-4 RNAi, let-805 RNAi or ifb-1 RNAi clones. Scale bar: 10 μm. (B) Quantification of results in (A) showing the number of GFP::LGG-1 puncta per unit area in the epidermis of worms treated with heat shock after damage of CeHD components compared with control. n ≥ 7 per condition. HS, heat shock. (C) Quantification of results in (A) showing the number of GFP::LGG-1 puncta per unit area in the epidermis of worms treated with paraquat after damage of CeHD components compared with control. n ≥ 11 per condition. (D) Representative confocal images showing the distribution patterns of GFP::LGG-1 driven by its own promoter in the epidermis of wild-type (WT) or epg-5(tm3425) young adults treated with L4440 (control) or mup-4 RNAi. Scale bar: 10 μm. (E) Quantification of the number of GFP::LGG-1 puncta in the epidermis of animals with the indicated genotypes, corresponding to results in (D). n ≥ 7 per condition. (F) Representative confocal images showing the protein levels of SQST-1::GFP driven by the epidermal-specific promoter Pcol-19 in sham-treated adults fed with L4440 (control) or mup-4 RNAi, heat shock (HS) or paraquat-treated animals fed with L4440 or mup-4 RNAi clones. Scale bar: 40 μm. (G and H) Quantification of the relative Pcol-19::SQST-1::GFP abundance with the indicated treatments, corresponding to results in (F). n ≥ 26 per condition. Error bars represent mean ± SEM. ns, not significant; **, P < 0.01; ***, P < 0.001; ****, P < 0.0001 (two-tailed, unpaired t-test).
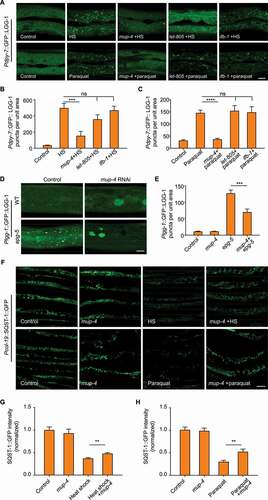
Figure 4. Basal structural damage promotes epidermal autophagy through a mechanotransduction pathway mediated by the basal CeHD receptor and LET-363/MTOR. (A) Representative confocal images showing the distribution patterns of GFP::LGG-1 driven by the epidermal-specific Pdpy-7 promoter in the young adults treated with the empty vector L4440 (control), unc-97 RNAi, pat-6 RNAi or pat-2 RNAi. (B) Representative confocal images showing the distribution patterns of Pdpy-7::GFP::LGG-1 puncta in the young adults treated with L4440 or unc-52 RNAi in the presence or absence of muscimol. (C) Quantification of the number of GFP::LGG-1 puncta per unit area in the epidermis with the indicated treatments, corresponding to results in (B). n = 6 per condition. (D) Representative confocal images showing the distribution patterns of Pdpy-7::GFP::LGG-1 puncta in the young adults treated with L4440 or let-805 RNAi in the presence or absence of muscimol. (E) Quantification of the number of GFP::LGG-1 puncta per unit area in the epidermis with the indicated treatments, corresponding to results in (D). n = 7 per condition. (F) Representative confocal images showing the distribution patterns of Pdpy-7::GFP::LGG-1 puncta in the young adults treated with L4440 or let-363 RNAi in the presence or absence of muscimol. (G) Quantification of the number of GFP::LGG-1 puncta per unit area in the epidermis with the indicated treatments, corresponding to results in (F). n ≥ 10 per condition. (H) Western blot analysis showing the total protein level and the phosphorylation level of LET-363/MTOR on serine 2448 in wild-type (WT) and unc-52(e1421) young adults. Tubulin was used as the loading control. Scale bars: 10 μm. Error bars represent mean ± SEM. ns, not significant; ***, P < 0.001 (two-tailed, unpaired t-test).
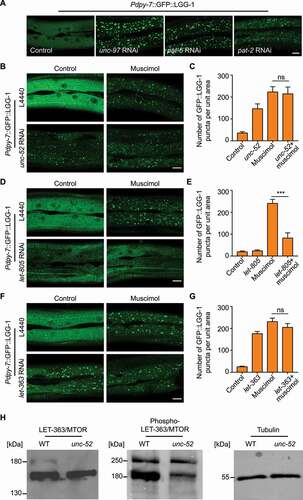
Figure 5. Epidermal structural damage inhibits the autophagy process via activation of calcium influx. (A) Representative confocal images showing the distribution patterns of epidermal GFP::LGG-1 puncta and GCaMP3 fluorescence in the adults with an intact epidermis (control) or a single wound caused by needle puncture. Arrows point to sites of wounding. Scale bar: 40 μm. (B) Representative confocal images showing the fluorescent levels of epidermal GCaMP3 in the animals treated with the empty vector L4440 (control) or mup-4 RNAi. Scale bar: 40 μm. (C) Quantification of the relative GCaMP3 fluorescence in the epidermis with the indicated treatments, corresponding to results in (B). n = 12 per condition. (D) Representative confocal images showing the distribution patterns of Plgg-1::GFP::LGG-1 puncta in wild-type (WT) or gtl-2(n2618) young adults treated with or without needle wounding. Arrows point to sites of wounding. Scale bar: 10 μm. (E) Quantification of the number of GFP::LGG-1 puncta per unit area in the epidermis with the indicated treatments, corresponding to results in (D). n ≥ 10 per condition. (F) Representative confocal images showing the distribution patterns of Plgg-1::GFP::LGG-1 puncta in wild-type (WT) or gtl-2(n2618) young adults soaked with CaCl2 or control solution for 1 h after needle wounding. Arrows point to sites of wounding. Scale bar: 10 μm. (G) Quantification of the number of GFP::LGG-1 puncta per unit area in the epidermis with the indicated treatments, corresponding to results in (F). n ≥ 7 per condition. (H) Representative confocal images showing the distribution patterns of Plgg-1::GFP::LGG-1 puncta in wild-type (WT) or gtl-2(n2618) young adults treated with or without mup-4 RNAi. Scale bar: 10 μm. (I) Quantification of the number of GFP::LGG-1 puncta per unit area in the epidermis with the indicated treatments, corresponding to results in (H). n ≥ 16 per condition. Error bars represent mean ± SEM. ns, not significant; **, P < 0.01; ***, P < 0.001; ****, P < 0.0001 (two-tailed, unpaired t-test).
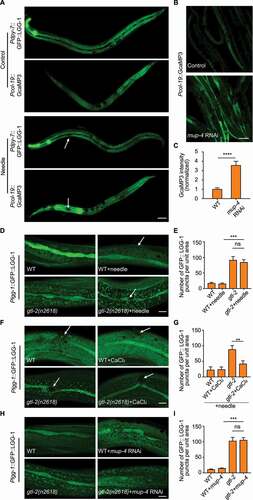
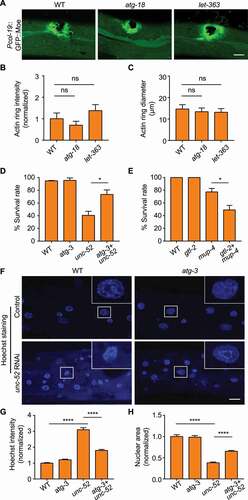
Figure 6. Elevated autophagy plays a detrimental role during epidermal structural damage. (A) Representative confocal images showing the formation of actin rings visualized by Pcol-19::GFP::Moe in wild-type (WT), atg-18(gk378) and let-363 RNAi-treated adults after needle wounding. (B) Quantification of the relative intensities of the actin rings, corresponding to results in (A). n ≥ 9 per condition. (C) Quantification of the average diameter of the actin rings, corresponding to results in (A). n ≥ 7 per condition. (D) Survival rates of wild type (WT) and the atg-3(bp412) single mutant combined with or without unc-52(e1421) mutation (three biological replicates, n = 30 per condition). (E) Survival rates of wild type (WT) and the gtl-2(n2618) single mutant treated with or without mup-4 RNAi (three biological replicates, n = 30 per condition). (F) Hoechst staining showing epidermal nuclei of wild type (WT) and the atg-3(bp412) single mutant combined with or without unc-52 RNAi. Insets correspond to boxed areas in each image. (G) Quantification of the relative intensities of nuclear Hoechst staining in the epidermis of animals with the indicated genotypes, corresponding to results in (F). n ≥ 8 per condition. (H) Quantification of the relative sizes of the nuclei in the epidermis of animals with the indicated genotypes, corresponding to results in (F). n ≥ 8 per condition. Scale bars: 10 μm. Error bars represent mean ± SEM. ns, not significant; *, P < 0.05; ****, P < 0.0001 (two-tailed, unpaired t-test).