Figures & data
Figure 1. WIPI2 is recruited to damaged mitochondria. (A) YPH cells were treated with or without 1 μM O/A for 4 h. Subcellular fractionation was then performed to isolate the cytosolic and mitochondrial fractions. TIMM23 and GAPDH were used as mitochondrial and cytosolic markers, respectively. (B-D) YPH cells were treated with or without 20 μM CCCP. Subsequently, the cells were fixed at the indicated time points and stained with antibodies against WIPI2 and HSPD1. The cells were then imaged under a confocal microscope (B). Scale bar: 10 μm. The number of WIPI2 puncta per cell was quantified and presented in (C) and colocalization of WIPI2 with HSPD1 was quantified by Mander’s overlap coefficient (D). 120 cells from three independent experiments were analyzed. Columns, mean; bars, ± S.D. (*, P < 0.05; **, P < 0.01; ****, P < 0.0001; One way ANOVA with Dunnett’s multiple comparisons test). (E) YPH cells were treated with or without 20 μM CCCP. Subsequently, the cells were fixed at the indicated time points and stained with antibodies against WIPI2 and CALCOCO2. The cells were then imaged under a confocal microscope. Scale bar: 10 μm. (F) The percentage of WIPI2 puncta colocalized with CALCOCO2 was quantified in cells treated as in (E). 120 cells from three independent experiments were analyzed. Columns, mean; bars, ± S.D. (*, P < 0.05; ***, P < 0.001; ****, P < 0.0001; One way ANOVA with Dunnett’s multiple comparisons test). (G) YPH cells were treated with or without 20 μM CCCP. Subsequently, the cells were fixed at the indicated time points and stained with antibody against WIPI2 and OPTN. The cells were then imaged under a confocal microscope. Scale bar: 10 μm. (H) The percentage of WIPI2 puncta colocalized with OPTN was quantified in cells treated as in (G). 120 cells from three independent experiments were analyzed. Columns, mean; bars, ± S.D. (**, P < 0.01; ****, P < 0.0001; One way ANOVA with Dunnett’s multiple comparisons test).
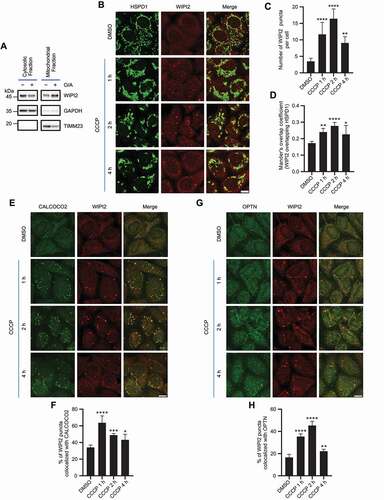
Figure 2. Depletion of WIPI2 inhibits mitophagy. (A and B) YPH wild-type (WT) or WIPI2 KO cells were treated with either 20 μM CCCP (A) or 1 μM O/A (B) and harvested at the indicated time points for western blotting analysis with the indicated antibodies. (C) YPH-mt-Keima WT or WIPI2 KO cells were lysed for western blotting analysis to confirm the knockout effects of WIPI2. (D-F) YPH-mt-Keima WT or WIPI2 KO cells were treated with 20 μM CCCP and harvested at the indicated time points for FACS analysis by excitation at 405 nm (neutral pH) and 561 nm (acidic pH). The gated area encloses cells undergoing mitophagy, and the percentage of cells within this gate is indicated in the top-left corner of each plot (D). The percentage of cells undergoing mitophagy (E) and the relative mean mt-Keima 561/405 ratio (F) were quantified in cells treated as in (D). Columns, mean; bars, ± S.D. of 3 independent experiments (N.S., no significance; *, P < 0.05; **, P < 0.01; ****, P < 0.0001; Two-way ANOVA with Sidak’s multiple comparisons test). (G and H) YPH WT or WIPI2 KO cells were treated with either DMSO or 20 μM CCCP for 6 h and then fixed with 4% PFA. The cells were then stained with anti-DNA antibody and imaged under microscope (G). Scale bar: 20 μm. The relative intensity of mtDNA in the samples treated as in (G) was quantified (n = 30) (H). The intensity of the mtDNA in the WT group treated with DMSO was normalized as 1. Columns, mean; bars, ± S.D. (N.S., no significance; ****, P < 0.0001; Two-way ANOVA with Sidak’s multiple comparisons test).
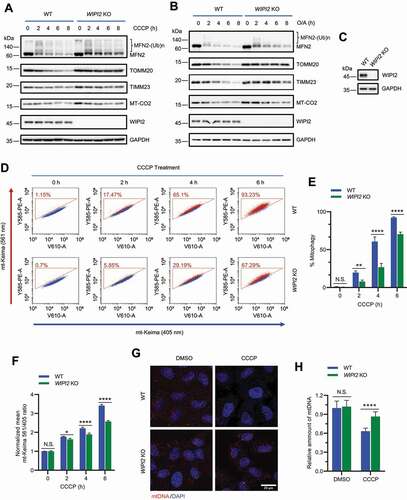
Figure 3. WIPI2 interacts with the VCP complex. (A) YPH cells were treated with or without 20 μM CCCP for 2 h. Subsequently, the cells were harvested for immunoprecipitation with anti-WIPI2 antibody and analyzed by western blotting. (B and C) HEK293T cells were transfected with WIPI2-MYC and/or FLAG-VCP as indicated for 24 h and were lysed with IP lysis buffer. The cell lysates were subjected to MYC IP (B) or FLAG IP (C) and analyzed by western blotting. (D) Schematic diagram of VCP full length construct or VCP constructs deleted by the indicated domains. (E) HEK293T cells were transfected with plasmids described in (D) for 24 h. The cells were then lysed and subjected to IP with antibody against HA and analyzed by western blotting. (F) HEK293T cells were transfected with WIPI2-MYC and either empty vector, UBXN6-HA, UFD1-HA or NPLOC4-HA as indicated for 24 h and were lysed with IP lysis buffer. The cell lysates were then subjected to immunoprecipitation with anti-HA antibody and blotted with the indicated antibodies. (G and H) YPH cells were treated with 20 μM CCCP for 4 h, fixed with 4% PFA, stained with antibodies against NPLOC4 and HSPD1, and imaged under microscope (G). Scale bar: 10 μm. Colocalization between NPLOC4 and HSPD1 as in (G) was evaluated by Mander’s overlap coefficient (H). 120 cells from three independent experiments were analyzed. Columns, mean; bars, ± S.D. (**, P < 0.01; Student t-test).
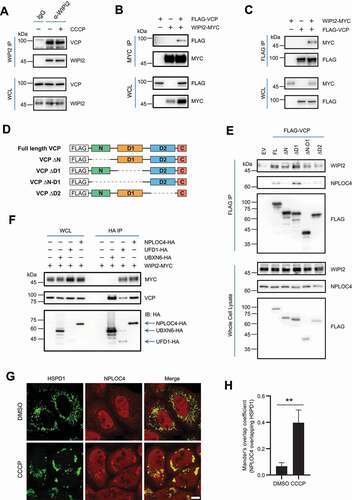
Figure 4. WIPI2 KO impaired mitochondrial recruitment of VCP. (A and B) YPH cells were pretreated with or without NMS873 (10 μM) for 1 h and were then treated with either DMSO or CCCP (20 μM) as indicated for 4 h. The cells were subsequently fixed with 4% PFA, stained with antibodies against VCP and HSPD1, and imaged under microscope (A). Scale bar: 10 μm. Colocalization between VCP and HSPD1 as in (A) was evaluated by Mander’s overlap coefficient (B). 120 cells from three independent experiments were analyzed. Columns, mean; bars, ± S.D. (****, P < 0.0001; One way ANOVA with Dunnett’s multiple comparisons test). (C) YPH cells were pretreated with or without NMS873 (10 μM) for 1 h and were then treated with either DMSO or O/A (1 μM) as indicated. The cells were then harvested at the indicated time points and subjected to western blotting analysis with the indicated antibodies. (D) YPH cells were pretreated with either DMSO, CQ (25 μM), BafA1 (50 nM) or MG132 (10 μM) for 1 h. Subsequently, the cells were treated with or without CCCP (20 μM) for 6 h and subjected to western blotting analysis with the indicated antibodies. (E) YPH WT and WIPI2 KO cells were pretreated with or without NMS873 (10 μM) for 1 h. The cells were then treated with either DMSO or CCCP (20 μM) for 4 h and subjected to western blotting analysis with the indicated antibodies. (F and G) YPH WT and WIPI2 KO cells were treated with either DMSO or CCCP (20 μM) for 4 h. The cells were subsequently fixed with 4% PFA, stained with antibodies against VCP and HSPD1, and imaged under microscope (F). Scale bar: 10 μm. Colocalization between VCP and HSPD1 as in (F) was analyzed by Mander’s overlap coefficient (G). 120 cells from three independent experiments were analyzed. Columns, mean; bars, ± S.D. (N.S., no significance; ****, P < 0.0001; Two-way ANOVA with Sidak’s multiple comparisons test).
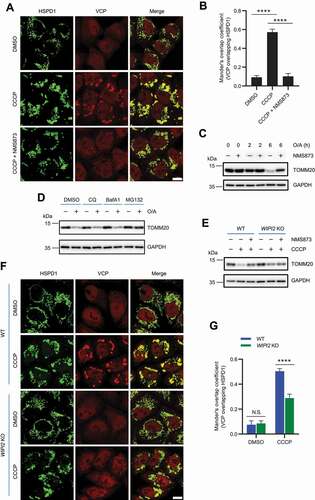
Figure 5. Reconstitution of WIPI2 rescues the impaired mitochondrial recruitment of VCP and defective mitophagy in WIPI2 KO cells. (A and B) YPH WT and WIPI2 KO cells transfected with or without FLAG-WIPI2 were treated with either DMSO or CCCP (20 μM) for 4 h. The cells were then fixed with 4% PFA, stained with anti-HSPD1 and anti-VCP antibodies and imaged under microscope (A). Scale bar: 10 μm. Colocalization between VCP and HSPD1 as in (A) was evaluated by Mander’s overlap coefficient (B). 120 cells from three independent experiments were analyzed. Columns, mean; bars, ± S.D. (****, P < 0.0001; One way ANOVA with Dunnett’s multiple comparisons test). (C) YPH WT and WIPI2 KO transfected with either empty vector (EV) or FLAG-WIPI2 for 24 hours were treated with CCCP (20 μM) and harvested at the indicated time points for western blotting analysis with the indicated antibodies. (D-F) YPH-mt-Keima WT and WIPI2 KO cells transfected with or without FLAG-WIPI2 were treated with 20 μM CCCP. The cells were then harvested at the indicated time points for FACS analysis by excitation at 405 nm (neutral pH) and 561 nm (acidific pH). The gated area encloses cells undergoing mitophagy, and the percentage of cells within this gate is indicated in the top-left corner of each plot (D). The percentage of cells undergoing mitophagy (E) and the relative mean mt-Keima 561/405 ratio (F) were then quantified in cells treated as in (D). Columns, mean; bars, ± S.D. of 3 independent experiments (N.S., no significance; **, P < 0.01; ***, P < 0.001; ****, P < 0.0001; Two-way ANOVA with Sidak’s multiple comparisons test).
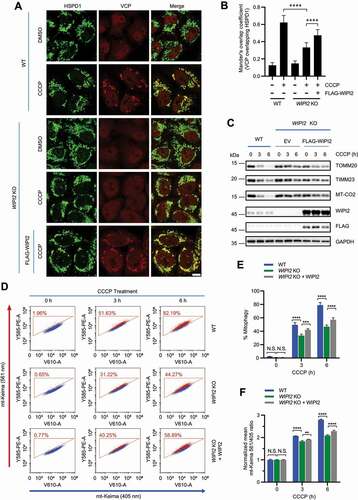
Figure 6. WIPI2 KO cells are resistant to cell death induced by mitochondrial depolarization. (A) Subcellular fractionation was performed to isolate the cytosolic and mitochondrial fractions in YPH WT and WIPI2 KO cells treated with O/A (1 μM) for 4 h. The samples were then analyzed by western blotting with the indicated antibodies. TIMM23 and GAPDH (glyceraldehyde-3-phosphate dehydrogenase) were used as mitochondrial and cytosolic markers, respectively. (B) YPH WT and WIPI2 KO cells were treated with either DMSO or O/A (1 μM) for 24 h. The cells were then harvested for western blotting analysis with the indicated antibodies. (C) YPH WT and WIPI2 KO cells were treated with either DMSO or CCCP (20 μM) for 24 h. The cells were then imaged with phase contrast microscopy. Scale bar: 50 μm. (D) YPH WT and WIPI2 KO cells treated as in (C) were stained with propidium iodide (PI) and subjected to FACS analysis. Columns, mean; bars, ± S.D. of 3 independent experiments (N.S., no significance; ****, P < 0.0001; Two-way ANOVA with Sidak’s multiple comparisons test). (E) YPH WT and WIPI2 KO cells were treated with either DMSO or O/A (1 μM) for 24 h. Subsequently, the cells were stained with PI and subjected to FACS analysis. Columns, mean; bars, ± S.D. of 3 independent experiments (N.S., no significance; ****, P < 0.0001; Two-way ANOVA with Sidak’s multiple comparisons test).
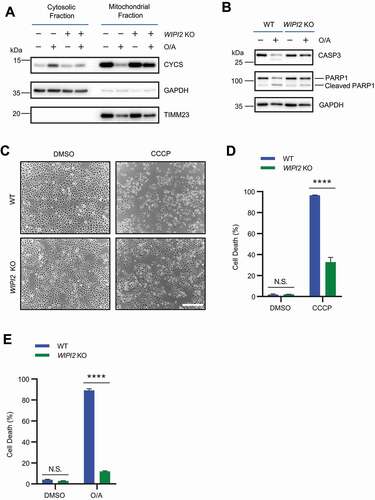
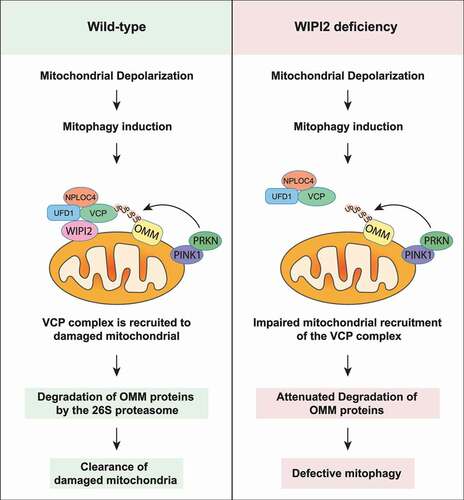
Figure 7. Schematic model for the positive regulatory role of WIPI2 in mitophagy. Upon mitochondrial depolarization, WIPI2 and the VCP complex are recruited to damaged mitochondria. VCP then extracts the OMM proteins ubiquitinated by PRKN and delivered them to the 26S proteasome for degradation. This process ultimately promotes the clearance of damaged mitochondria via mitophagy. Upon WIPI2 deficiency, mitochondrial recruitment of VCP is impaired, which impairs degradation of OMM proteins and delays mitophagy.