Figures & data
Figure 1. Counteractive crosstalk between S. Typhimurium and host cells via autophagy. (A) RAW264.7 cells were infected with S. Typhimurium of MOI 10 for 6 h and analyzed by immunoblotting. (B) RAW264.7 cells were infected with S. Typhimurium of indicated multiplicity of infection (MOI) for 6 h and analyzed by immunoblotting. (C) HeLa cells were infected with S. Typhimurium of MOI 10 for indicated time periods and analyzed by immunoblotting. (D) RAW264.7 cells were infected with S. Typhimurium of indicated MOI and treated with 100 nM bafilomycin A1 for 4 h before analyzing by immunoblotting. (E) RAW264.7 cells were treated with 100 ng/mL LPS for 6 h and analyzed by immunoblotting. (F) Puncta formation assay of LC3 (green) in HeLa cells treated with 100 ng/mL LPS for 6 h. Scale bar: 10 μm. (G) RAW264.7 cells were infected with S. Typhimurium for 5 h and followed by 1 h 20 mM NH4Cl treatment for autophagy flux analysis. (H) Relative fold change in mRNA level of autophagy related genes in uninfected and S. Typhimurium-infected HeLa cells were analyzed by RT-qPCR. (I) HeLa cells were infected with S. Typhimurium MOI of 10 for 3 h. Scale bar: 5 μm. (J) Graph of CFU indicating intracellular S. Typhimurium in HeLa cells transfected with siRNA control or siRNA targeting SQSTM1. (K) Graph of CFU indicating intracellular S. Typhimurium in HeLa cells transfected with siRNA control or siRNA targeting LC3 or ATG5 (left panel). Immunoblotting analysis of siRNA-transfected cells for validation of protein depletion (right panel). (L) HeLa cells were infected with S. Typhimurium MOI of 10 for 6 h. (M) Relative fold change in mRNA level of autophagy receptors in uninfected and S. Typhimurium-infected HeLa cells were analyzed by RT-qPCR. UI, uninfected; Sal, S. Typhimurium.
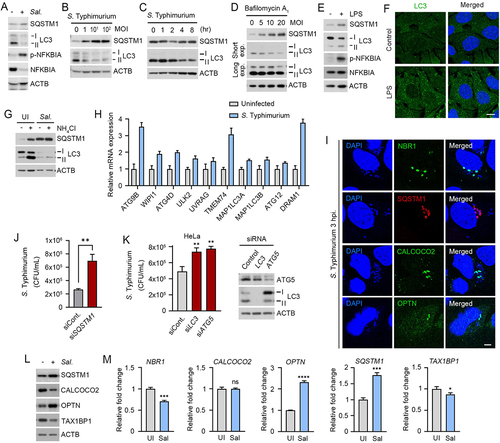
Figure 2. Development of small molecule agonists that exert antimicrobial efficacy. (A) S. Typhimurium-infected RAW264.7 cells were incubated with SQSTM1 agonists including YTK-A76, YT-6-2, YOK-1204, YTK-2205, and YOK-1109 at indicated concentrations for 6 h. The number of intracellular bacteria was measured by CFU assay. (B) Graph of CFU indicating intracellular S. Typhimurium in RAW264.7 cells treated with indicated concentrations of YTK-A76 for 6 h. (C) RAW264.7 cells were infected with S. Typhimurium MOI of 10 and the cells were incubated with or without YTK-A76 (5 μM) for indicated times. (D) RAW264.7 cells were infected with indicated MOI of S. Typhimurium followed by 10 μM YTK-A76 treatment for 6 h and measured intracellular S. Typhimurium by CFU assay. (E) Graph of colony-forming unit (CFU) indicating the number of intracellular S. Typhimurium in HCT116 and HeLa cells treated with 10 μM YTK-A76 for 6 h. (F) S. Typhimurium was cultured in LB culture media with SQSTM1 agonists (15 μM) or gentamicin (30 μM) at 37°C. The OD600 was measured every hour until 12 h. (G) RAW264.7 cells were treated with SQSTM1 agonists at indicated concentrations for 72 h and cell viability was measured by WST assay. (H) Surface electrostatic potential of SQSTM1 ZZ domain in complex with Arg-Glu peptide (PDB ID: 6MIU). Docked YT-6-2 compound (green) was superimposed with Arg-Glu peptide (yellow) as substrate (left panel). The predicted binding mode of YT-6-2 showing binding site of YT-6-2 to SQSTM1 ZZ domain where expected to overlap the substrate binding site of SQSTM1 (right panel). (I) Pulldown assay using biotinylated YT-6-2 and SQSTM1 wild type or SQSTM1 ZZ point mutant (D147K) plasmids expressed in SQSTM1−/− HeLa cells. 500 μg of total protein was used in pulldown assay, and SQSTM1 was detected by immunoblotting analysis using anti-Flag antibody.
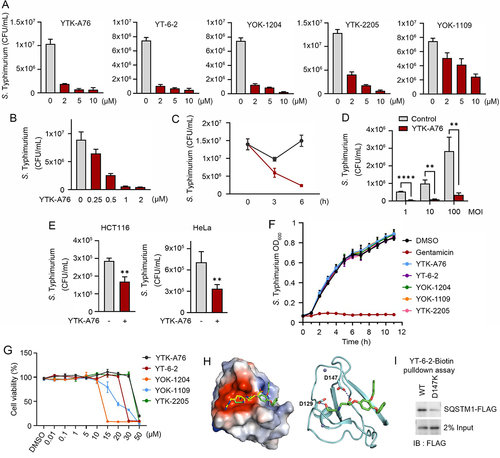
Figure 3. SQSTM1 agonists rescue autophagic activities from suppression by S. Typhimurium. (A) HeLa cells were treated with SQSTM1 agonists (YTK-A76, YT-6-2, YOK-1204, YTK-2205 and YOK-1109) at indicated concentrations for 6 h and lipidation of LC3 was analyzed by immunoblotting assay. (B) HeLa cells were treated with p62 agonists at 5 μM for 6 h and immunostained with SQSTM1 and LC3 antibodies. Scale bar: 10 μm. (C) HeLa cells were treated with 5 μM YTK-A76 alone or with 20 mM NH4Cl for 6 h for autophagy flux analysis. (D) HeLa cells were infected with S. Typhimurium at MOI 10 and SQSTM1 agonist was treated for 6 h and LC3 lipidation analyzed by immunoblotting. (E) BMDMs were infected with S. Typhimurium MOI of 10 and YTK-A76 were treated dose dependently at indicated concentrations for 6 h. (F) S. Typhimurium-infected HeLa cells were treated with 10 μM YTK-A76 alone or with 20 mM NH4Cl for autophagy flux analysis. (G) Uninfected and S. Typhimurium- (MOI 10) infected HeLa cells were treated with rapamycin at indicated concentrations for 6 h. NT, non-treated.
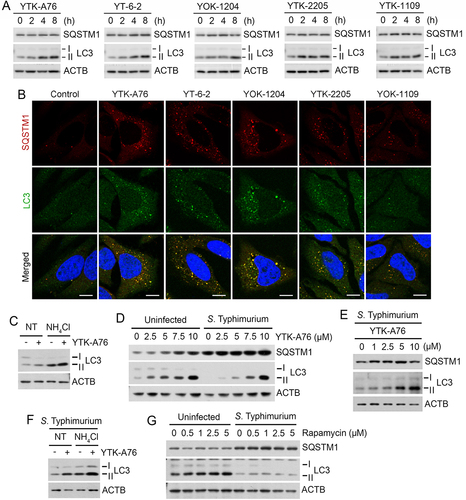
Figure 4. SQSTM1 agonists exert antimicrobial efficacy by binding to the ZZ domain of SQSTM1. Scale bars: 10 μm. (A) Graph of CFU indicating intracellular S. Typhimurium for validation of SQSTM1-dependent xenophagy in HeLa cells treated with SQSTM1 agonist 10 μM for 5 h. HeLa cells were transfected with control or SQSTM1 targeting siRNA for 48 h before infection. (B) HeLa cells were knockdown by 3’UTR siSQSTM1 for 48 h and SQSTM1-EGFP or SQSTM1-ZZΔ-EGFP was rescued for 24 h. The cells were infected with S. Typhimurium and treated with or without 10 μM YTK-A76 for 5 h and harvested for CFU assay. (C) Colocalization analysis of SQSTM1 (red) and S. Typhimurium (cytosolic DAPI) by using immunostaining. Representative images of S. Typhimurium-infected HeLa cells treated with YTK-A76 for 6 h. (D) 3’UTR SQSTM1 knockdown HeLa cells were transfected with SQSTM1-EGFP or SQSTM1-ZZΔ-EGFP and the cells were infected with S. typhimurium and incubated with or without YTK-A76 10 μM for 5 h. (E) 3’UTR SQSTM1 knockdown HeLa cells were rescued with SQSTM1-MYC or SQSTM1-UBAΔ-MYC or SQSTM1-PB1Δ-MYC and YTK-A76 was treated for 5 h. (F and G) HeLa cells were transfected with siControl or siUBB followed by S. Typhimurium infection (MOI 10). After 30 min of S. Typhimurium infection, cells were treated with or without YTK-A76 at 10 μM for 5 h. Immunofluorescence analyses (F) and CFU assays (G) were performed.
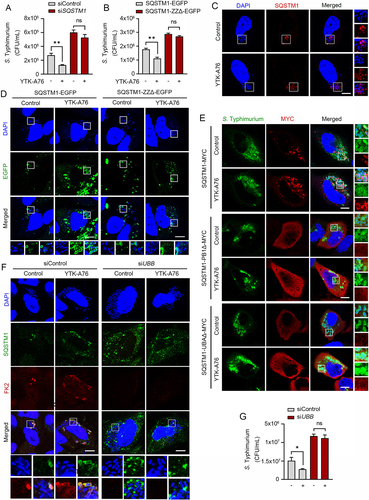
Figure 5. SQSTM1 agonists induce xenophagy of S. Typhimurium by facilitating the target of the pathogens to the autophagosome. (A) Colocalization analysis of LC3 (green), SQSTM1 (red) and S. Typhimurium (cytosolic DAPI) by immunofluorescence analyses. Representative images (left panel) of S. Typhimurium-infected HeLa cells treated with 10 μM YTK-A76 for 6 h. Quantitative graph represents the average percentage of S. Typhimurium colocalized with SQSTM1+ LC3+ puncta per cells (n = 15). Scale bar: 10 μm. (B) Graph of CFU indicating intracellular S. Typhimurium in HeLa cells treated with SQSTM1 agonist in the presence or absence of 20 mM NH4Cl. (C) Graph of CFU indicating intracellular S. Typhimurium in HeLa cells treated with SQSTM1 agonist for validation of autophagic degradation of S. Typhimurium. HeLa cells were transfected with control, ATG5 or LC3B targeting siRNA for 48 h before infection. The cells were treated with or without YTK-A76 10 μM for 5 h. (D) Representative TEM (transmission electron microscopy) images of RAW264.7 cells treated with or without YTK-A76 at 10 μM for 4 h in the presence of intracellular S. Typhimurium (yellow boxes were magnified). (E) RAW264.7 cells were infected with S. Typhimurium (MOI 10) for 30 min and rapamycin was treated at indicated concentrations for 6 h. (F) S. Typhimurium- (MOI 10) infected RAW264.7 cells treated with rapamycin at 5 μM for indicated time points and the number of intracellular bacteria was measured by CFU analyses. (G) Colocalization analysis of S. Typhimurium (green) and SQSTM1 (red) in HeLa cells with presence or absence of 10 μM rapamycin for 6 h. Scale bar: 5 μm. (H) S. Typhimurium-infected RAW264.7 cells treated with resveratrol at indicated concentrations for 6 h and the number of intracellular bacteria was measured by CFU assay.
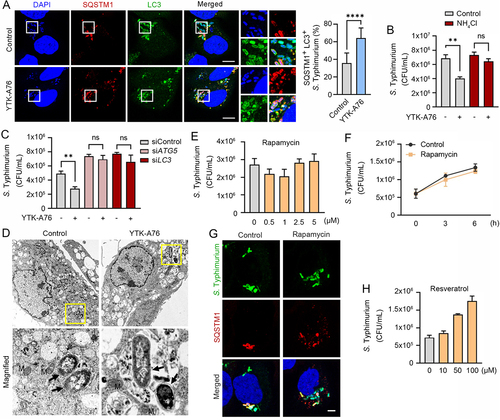
Figure 6. SQSTM1 agonists enhance host innate immunity against Mtb and other pathogens via SQSTM1-mediated xenophagy. (A) Intracellular survival of Mtb assessed in BMDMs treated with YTK-A76 (1, 5, or 10 µM) and YTK-2205 (1, 5, or 10 µM) for 3 days. (B) BMDMs were transduced with lentivirus expressing shNS or shSqstm1, and then treated with YTK-2205 (5 µM) for 3 days. Intracellular survival of Mtb measured by CFU assay. (C) BMDMs were infected with Mtb-ERFP (MOI of 5) for 2 h and then cells were treated with YTK-2205, YTK-A76, or YOK-1109 at 5 μM for 18 h. Colocalization analysis of SQSTM1 (green) and Mtb-ERFP by immunofluorescence analysis. Scale bar: 5 µm. (D) BMDMs were infected with Mtb-ERFP (MOI of 5) and treated with YTK-2205 (5 μM). Colocalization analysis of LC3 (green) and Mtb-ERFP in BMDMs by using immunostaining analysis. Scale bar: 8 µm (left panel). Quantitative graph represents the average percentage of Mtb-ERFP colocalized with LC3 puncta per cells (right panel; n = 11). (E) Representative TEM images of BMDMs treated with YTK-2205 (5 μM) under uninfected or Mtb-infected conditions. Scale bars: 2 µm and 1 µm (left panel). The quantitative graph represents the proportion of Mtb in compartment of autophagosomes or phagosomes in BMDMs (right panel). (F) RAW264.7 cells infected with E. coli for 30 min followed by incubation with SQSTM1 agonist at 10 μM for 6 h. (G) J774A.1 infected with S. pyogenes and treated with SQSTM1 agonist at 10 μM for 6 h. The number of intracellular bacteria was measured by CFU assay.
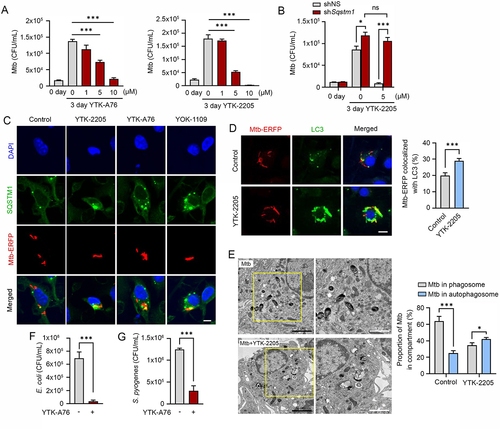
Figure 7. The SQSTM1 agonists enhance xenophagy-mediated host defense against pathogens in mice. (A) Mice were injected p.o. with 1 × 10⁶ S. Typhimurium in PBS, followed by administration of SQSTM1 agonist (20 mg/kg) by i.p. once daily (n = 4 per group). Bacterial burdens in the liver (upper panel) and spleen (lower panel) were analyzed by CFU assay after 6 dpi. (B) Representative H&E staining images of liver from S. Typhimurium infection model injected i.p. with vehicle (Control) or 20 mg/kg YTK-2205. (C) Bacterial burdens in mouse lung tissues. Mice were infected i.n. with Mtb (5 × 10⁴ CFU). After infection, mice were treated with vehicle, YTK-2205 (i.p. 10 mg/kg; n = 7 per group, left), or YT-6-2 (i.p. 20 mg/kg; n = 5 per group, right). (D) Representative H&E-stained images in lung tissue of mice treated as in c. Scale bars: 2000 µm and 100 µm. (left panel). Quantitative graph represents the average percentage of inflamed area of tissue section (right panel). (E and F) Mice (n = 4 per group) were infected i.n. with BCG (1 × 10⁷ CFU), and treated with vehicle or YTK-2205 (i.p. 20 mg/kg) at 3–6 dpi. (E) Bacterial loads determined by CFU analysis. (F) H&E staining of the BCG-infected lung tissue and representative images are shown. Scale bars: 2000 µm and 100 µm (left panel). Quantitative graph represents the average percentage of inflamed area of tissue section (right panel). (G) Bacterial loads in mouse lung tissues. Mice (n = 4 per group) were infected i.n. with MDR-Mtb (5 × 10³ CFU), and treated with vehicle or YT-6-2 (i.p. 20 mg/kg).
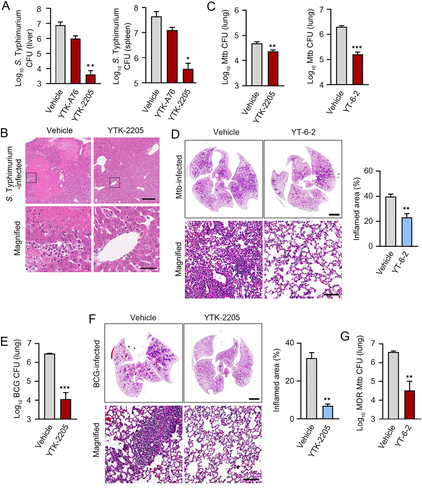
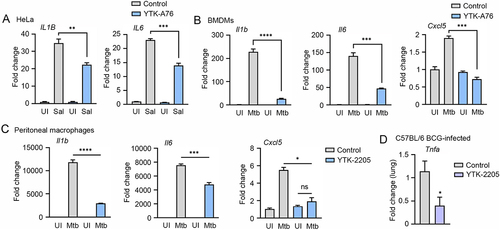
Figure 8. The SQSTM1 agonists inhibit the production of proinflammatory mediators in vitro and in mice. (A) Relative fold change in mRNA level of IL1B and IL6 in HeLa cells treated with or without YTK-A76 under S. Typhimurium infection was analyzed by RT-qPCR. (B and C) BMDMs (B) or peritoneal macrophages (C) were infected with Mtb (MOI of 5) and treated with YTK-A76 (5 µM; B) or YTK-2205 (5 µM; C) for 6 h. Relative fold change in mRNA level of Il1b, Il6, and Cxcl5 was determined using qRT-PCR. (D) Mice were infected i.n. with BCG (1 × 10⁷ CFU), and treated with vehicle or YTK-2205 (i.p. 20 mg/kg) at 3–6 dpi. Relative fold change in mRNA level of Tnfa from lung tissues was measured by qRT-PCR. UI, uninfected; Sal, S. Typhimurium.