Figures & data
Figure 1. VL-004 induces robust mitophagy in C. elegans. (A) Mito-Rosella sensor function. Under neutral pH the mito-Rosella green and red fluorescence intensities are comparable, while the acidic environment of the autolysosome causes a green fluorescence suppression. Therefore, a decrease in the green to red fluorescence ratio indicates mitophagy. (B) The effect of polyamine compounds on mitophagy in the body wall muscles (BWM) of C. elegans. Transgenic mito-Rosella worms were treated for 16 h with 1 mM of Spd, 1-methyl-spermidine (MetSpd), VL-002, VL-003, VL-004, and VL-005, whose structure is shown. N ≥ 10 worms/per treatment, n ≥ 3. (C) Colocalization of mitochondria and lysosome. Arrowheads indicate representative colocalization. The inset represents a nine-fold enlargement – scale bar: 20 μm. (D) Quantification of colocalization. N = 40 worms/per treatment, n ≥ 3. (E) Mitochondrial to nuclear DNA ratio (mtDNA:nDNA). n = 8. In (B) and (D and E) asterisks indicate significance compared to vehicle. *p < 0.05, **p < 0.01, ***p < 0.001, NS = non-significant.
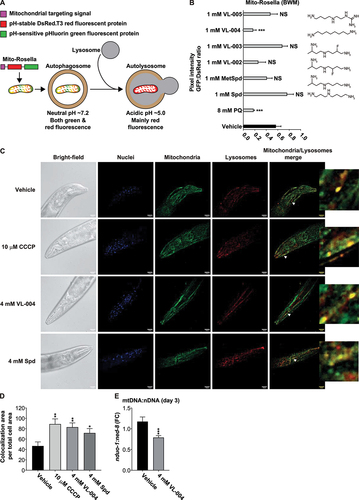
Figure 2. VL-004 protects against oxidative injury. Stacked bar graphs showing worms’ Survival in 200 mM PQ after 3 h and 6 h. (A) Protection against oxidative injury by VL-004 vs. Spd, MetSpd, VL-002, VL-003, and VL-005, at 1 mM. Dose-response of VL-004 (B), Spd (C), and MetSpd (D). (E) Mediators of the mitophagy pathway. The mitophagy genes dct-1 (F) and pink-1 (G) are essential for VL-004 protection. (H) Upper panel: PDR-1 is not essential for VL-004 activity in oxidative stress – lower panel: Schematic presentation of pdr-1 alternative transcripts (in gray). The relative positions of the gk448, tm598, tm396 deletion mutations are indicated by dark rectangular. For (A-D) and (F-G) graphs, n = 6. For (H), n = 9. Total number of worms in each experiment: (A) ≥ 134; (B-D) ≥ 112; (F and G) ≥ 133; (H ≥ 189). Asterisks indicate significance compared with vehicle/PQ treated worms. (I) VL-004 effect on autophagy/mitophagy gene expression. N2 worms were treated with 4 mM VL-004 for 48 h. Gene expression was measured by qPCR. n ≥ 4. *p < 0.05, **p < 0.01, ****p < 0.0001, NS = non-significant.
Figure 3. VL-004 induces bulk autophagy. (A) Transgenic mCherry::LGG-1 worms exposed to starvation, 4 mM VL-004, or vehicle. The inset represents a 40-fold enlargement. Scale bar: 50 μm. (B) Quantification of LGG-1 puncta. ****p < 0.0001. N ≥ 32 worms/per treatment, n = 3. (C-G) Stacked bar graphs displaying the survival of the atg-4.2(ola316), atg-16.2(ok3224), atg-18(gk378), and unc-51(e1189) autophagy mutants in 200 mM PQ after 3 h and 6 h. For (C-G) graphs, n = 6. Total number of worms in each experiment: (C) ≥ 138; (D) ≥ 144; (E and F) ≥ 145. Asterisks indicate significance compared with vehicle/PQ treated worms. ****p < 0.0001.
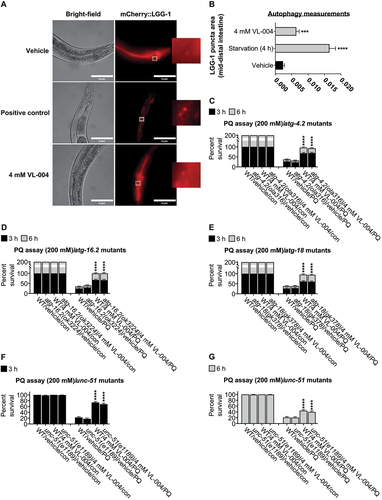
Figure 4. Role of canonical aging genes in VL-004 activity. (A-D) and (F-J) Stacked bar graphs showing worms’ Survival in 200 mM PQ after 3 h and 6 h, n = 6. Total number of worms was as followed: (A) ≥ 127; (B) ≥ 219; (C) ≥ 140; (D and F) ≥ 141; hlh-30 and sqst-1 mutants’ experiments were performed together, therefore shared same wild-type controls; (G) ≥ 124; (H) ≥ 142; (I) ≥ 155; (J) ≥175. (E) Bar graph quantifying mitophagy. Data represent an average of n = 30 animals/per treatment, N = 3. *p < 0.05, **p < 0.01, ***p < 0.001, ****p < 0.0001, ns = non-significant.
Figure 5. VL-004 promotes longevity and healthspan. (A) Survival curves of worms in the presence of VL-004, Spd, or vehicle. The summary of lifespan data is presented in Table S3.(B) Rhodamin-phalloidin staining of body-wall muscles of vehicle and VL-004 treated worms (in day 3 and day 11 post L1). Scale bar: 100 μm. (C) Quantification of rhodamin-phalloidin staining (head region, tip on the nose to the posterior bulb of the pharynx). N ≥ 35/per treatment, normalized to worm size by dividing fluorescence by head width (under the posterior bulb of the pharynx). n = 3. Speed (D) and thrashing (E) measurements. The speed/thrashing of worms was measured in the absence of bacteria. Speed (n = 6, N ≥ 48 worms/per treatment). Thrashing (n = 4, N ≥ 24/per treatment). (F) Food intake. (n ≥ 6, N ≥ 24 worms/per treatment). (G) Oxygen consumption rate (OCR) of wild-type worms treated with either vehicle or 4 mM VL-004 at day 3 and 11 (post L1). (n = 6, N ≥ 120 worms/per treatment). (H) OCR Quantification. Basal, maximal (FCCP), and non-mitochondrial (azide) are presented. (I) ATP levels in wild-type animals treated for 3 and 11 days as in (G). N = 3 (day 11) or N = 6 (day 3). (J) TMRE staining of 11 days SJ4103 worms grown with 4 mM VL-004 or vehicle. TMRE staining was normalized to mitochondrial GFP intensity. n = 3, N ≥ 48 worms/per treatment. (K) Mitochondrial to nuclear DNA ratio (mtDNA:nDNA). n = 9. *p < 0.05, **p < 0.01, ***p < 0.001, ****p < 0.0001, NS = non-significant.
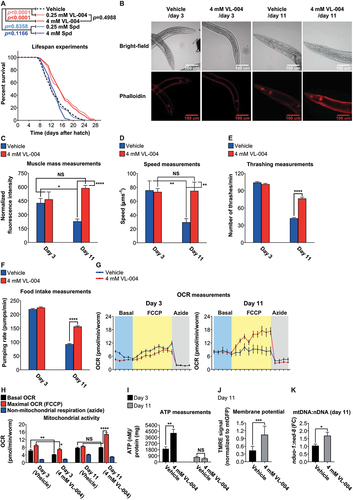
Figure 6. VL-004 does not change worms’ oxygen consumption rate. OCR (oxygen consumption rate) of wild-type worms (day 3 post L1) treated with the following stimulus train: VL-004 (at 0.25 mM, 1 mM, and 4 mM), 10 μM FCCP, and 40 mM azide. The experiments were performed in the absence of bacteria (A) or presence of heat-killed bacteria (C). n = 3, N ≥ 120 worms/per treatment). (B and D) OCR Quantification. Basal, vehicle/VL-004 treatments, maximal (FCCP), and non-mitochondrial (azide) are presented. Asterisks indicate significance compared with the vehicle treatment (maximal OCR comparison). *p < 0.05.
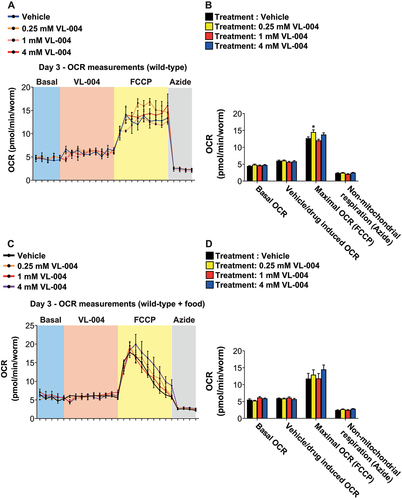
Figure 7. VL-004 kinetics and activity in worm models of neurodegenerative diseases. (A) Stacked bar graph comparing the survival of 1- and 6-days worms (in 200 mM PQ, after 3 h and 6 h) treated with 0.25 mM VL-004 for 48 h. (B-D) Bar graphs showing worms’ survival in 200 mM PQ. The worms (3 days post L1) were treated with 0.25 mM VL-004 for a fixed period of time, and their survival was measured after 3 hours in PQ. 3 and 6 h (B), 9 and 12 h (C), and 16 and 24 h (D). n = 6. Total number of worms: (A) ≥ 133; (B) ≥ 130; (C) ≥ 142; (D) ≥ 138. (E) Kaplan–Meier curves comparing the paralysis rate of AM141 worms grown on 0.25 mM or 4 mM of Spd or VL-004, n = 3, the total number of worms N ≥ 174, Day 0 = L4 stage of development. (F) Paralysis rates of AM141 worms bearing the dct-1(tm376) and pink-1(tm1779) mutations, compared to AM141 controls. n = 3, total number of worms N ≥ 92. (G) Thrashing measurements, AM725 transgenic worms. n ≥ 6. N ≥ 17 worms/per treatment. Asterisks represent significance compared to vehicle control within the comparison group, i.e., wild-type of mutated SOD-1. *p < 0.05, **p < 0.01, ***p < 0.001, ****p < 0.0001, NS = non-significant.
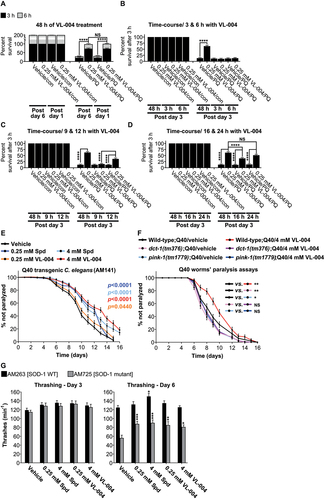
Figure 8. VL-004 activity in mammalian cells. (A) Colocalization of mitochondria and lysosome. Arrowheads indicate representative colocalization. The inset represents a nine-fold enlargement – scale bar: 50 μm. (B) Colocalization quantification. n ≥ 467 cells/per treatment.
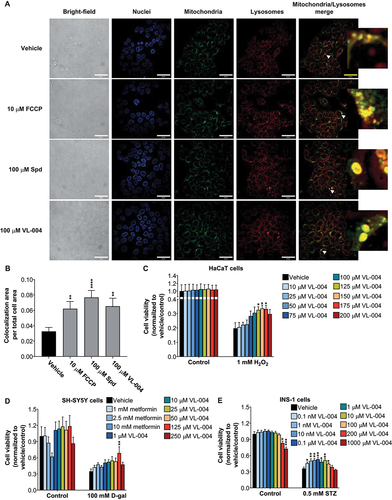
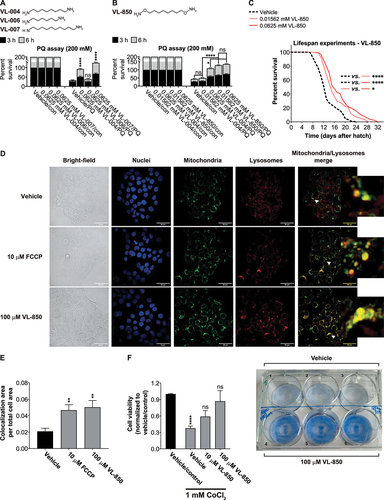
Figure 9. Carbon chain length and substituents affect diamine activity. (A and B) Stacked bar graphs showing worms’ Survival in 200 mM PQ after 3 h and 6 h. Graphs represent the average of six independent experiments: (A) ≥ 113; asterisks indicate significance compared to vehicle control; (B) ≥ 168. (C) Survival curves of worms in the presence of VL-850 or vehicle. The summary of lifespan data is presented in Table S3. (D) Colocalization of mitochondria and lysosome. Arrowheads indicate representative colocalization. The inset represents an eight-fold enlargement – scale bar: 50 μm. (E) Colocalization quantification. N = 3, ≥338 cells per treatment.(F) HaCat cells were incubated with VL-850 at the indicated concentrations for 24 h, then treated with 1 mM CoCl2 for 24 h. Cell viability was measured after 48 h by the methylene blue assay. Right panel, representative assay plates, top row – vehicle-treated, low – 100 μM VL-850. N ≥ 3.