
Figures & data
Figure 1. A human CLEC16A disease variant lacks a C-terminal IDPR. (A) Domain prediction of the human CLEC16A disease variant and human full-length CLEC16A generated by Pfam. The human CLEC16A disease variant is aligned beneath, and the shaded region represents sequence differing from human full-length CLEC16A. “FPL” is a domain of unknown function enriched in the amino acids phenylalanine (F), proline (P), and leucine (L). (B) Mean disorder score from IUPred 2, Disprot VSL2B, and DISOPRED 3.1 of full-length CLEC16A and the human CLEC16A disease variant. Putative disordered regions were identified with a probability threshold of >0.6. (C) Residue composition bias of the mouse CLEC16A C terminus generated with Composition Profiler, comparing residue enrichment of the CLEC16A C terminus vs Swiss-PROT 51 database. Significantly enriched serine (blue) and proline (pink) residues are highlighted. * p < 0.05. (D) Mouse CLEC16A C terminus residues (AA 892–1050) are listed in FASTA format. Serine residues are highlighted in blue, and proline residues are in pink. (E) Representative western blot (WB) in HEK293T cells transfected with Flag-CLEC16A constructs (full-length CLEC16A, CLEC16A lacking the C terminus [CLEC16A ∆C, AA 1–892], or CLEC16A C terminus-only [AA 892–1050]). VCL (vinculin) serves as a loading control. Expected molecular mass (MM) noted along top. Visualized molecular mass denoted by ladder. n = 3/group. (F) 1H-15N HSQC spectra of recombinant CLEC16A C terminus (AA 892–1050). Spectra clusters near 1H 8ppm, consistent with being an IDPR. (G) Assessment of secondary structure propensity of residue types identified by NMR. Secondary structure is shown as the difference between 13Cα and 13Cβ secondary chemical shifts. Stretches of values > 2 ppm indicate α-helix, values < 2 ppm indicate β-sheet.
![Figure 1. A human CLEC16A disease variant lacks a C-terminal IDPR. (A) Domain prediction of the human CLEC16A disease variant and human full-length CLEC16A generated by Pfam. The human CLEC16A disease variant is aligned beneath, and the shaded region represents sequence differing from human full-length CLEC16A. “FPL” is a domain of unknown function enriched in the amino acids phenylalanine (F), proline (P), and leucine (L). (B) Mean disorder score from IUPred 2, Disprot VSL2B, and DISOPRED 3.1 of full-length CLEC16A and the human CLEC16A disease variant. Putative disordered regions were identified with a probability threshold of >0.6. (C) Residue composition bias of the mouse CLEC16A C terminus generated with Composition Profiler, comparing residue enrichment of the CLEC16A C terminus vs Swiss-PROT 51 database. Significantly enriched serine (blue) and proline (pink) residues are highlighted. * p < 0.05. (D) Mouse CLEC16A C terminus residues (AA 892–1050) are listed in FASTA format. Serine residues are highlighted in blue, and proline residues are in pink. (E) Representative western blot (WB) in HEK293T cells transfected with Flag-CLEC16A constructs (full-length CLEC16A, CLEC16A lacking the C terminus [CLEC16A ∆C, AA 1–892], or CLEC16A C terminus-only [AA 892–1050]). VCL (vinculin) serves as a loading control. Expected molecular mass (MM) noted along top. Visualized molecular mass denoted by ladder. n = 3/group. (F) 1H-15N HSQC spectra of recombinant CLEC16A C terminus (AA 892–1050). Spectra clusters near 1H 8ppm, consistent with being an IDPR. (G) Assessment of secondary structure propensity of residue types identified by NMR. Secondary structure is shown as the difference between 13Cα and 13Cβ secondary chemical shifts. Stretches of values > 2 ppm indicate α-helix, values < 2 ppm indicate β-sheet.](/cms/asset/bf6f03ed-56b2-4edb-b38f-82f37f54c1f2/kaup_a_2080383_f0001_oc.jpg)
Figure 2. The CLEC16A C terminus maintains glucose homeostasis and β-cell function. (A) Schematic of the CLEC16Acurt protein and human CLEC16A disease variant. Shaded region represents sequence differing from full-length mouse CLEC16A. (B) Schematic of Clec16a locus, highlighting the 4-bp deletion within exon 22 of Clec16acurt mice. The MnlI recognition sequence is underlined. (C) Representative image of MnlI restriction digest following PCR amplification of genomic DNA containing Clec16a exon 22 as visualized by agarose gel electrophoresis. The Clec16acurt mutation eliminates the MnlI digestion site. n = 4/group. (D) Representative image of CLEC16A protein levels determined by WB in Clec16a+/+ and Clec16acurt/curt MEFs utilizing CLEC16A antisera raised against an internal CLEC16A peptide. n = 3/group. (E) Representative image of CLEC16A protein levels in Clec16a+/+ and Clec16acurt/curt isolated islets utilizing CLEC16A antisera raised against an internal CLEC16A peptide. n = 3/group. (F) Representative image of CLEC16A protein levels determined by WB in Clec16a+/+ and Clec16acurt/curt MEFs utilizing CLEC16A antisera raised against a C-terminal CLEC16A peptide. ACTB serves as loading control. n = 3/group. (G) Blood glucose concentrations measured during an intraperitoneal glucose tolerance test (IPGTT) of 16-week-old Clec16a+/+ and Clec16acurt/curt littermates. n = 8 Clec16a+/+, n = 4 Clec16acurt/curt. (H) Area under curve from IPGTT in Figure 2G. (I) Blood glucose concentrations during insulin tolerance test of 9-week-old Clec16a+/+ and Clec16acurt/curt littermates. n = 3–4/group. (J) Serum insulin measured during in vivo glucose-stimulated insulin release in 11-week-old Clec16a+/+ and Clec16acurt/curt littermates. n = 4–5/group. (K) Fold glucose-stimulated insulin secretion following static incubations in 1.67 mM and 16.7 mM glucose in isolated Clec16a+/+ and Clec16acurt/curt islets from 11-week-old littermates. n = 6/group. *p < 0.05 **p < 0.01.
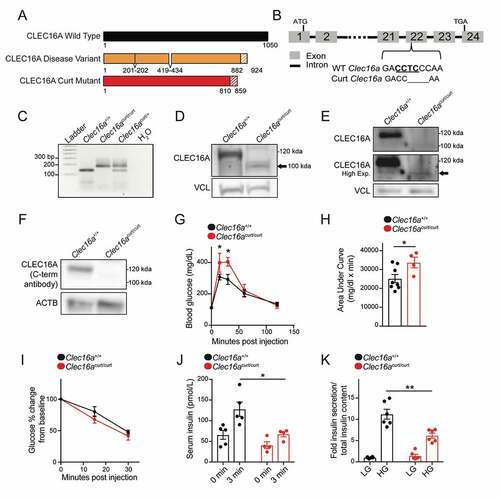
Figure 3. The CLEC16A C terminus maintains β-cell mitochondrial function, morphology, and turnover. (A) Representative transmission electron microscopy (TEM) images of β-cells in isolated islets from 11-week-old Clec16a+/+ and Clec16acurt/curt islets. Clec16acurt/curt islets have distorted mitochondria cristae. n = 4/group. (B) Quantification of β-cell mitochondrial structure from TEM images of Clec16a+/+ and Clec16acurt/curt β-cells related to Figure 3A. Dashed line in violin plot represents median and solid lines represent quartiles. n = 206–236 images scored/group. (C) Relative oxygen consumption rate (OCR) in isolated Clec16a+/+ and Clec16acurt/curt islets measured after exposure to low glucose (1.67 mM) and high glucose (16.7 mM). n = 12/group. (D) Representative MFN2 WB in isolated islets from Clec16a+/+ and Clec16acurt/curt mice following 250 nM valinomycin exposure for up to 6 h, quantified by densitometry (normalized to PPIB/cyclophilin B loading control, below). n = 4–5 mice/group. (E) Flow cytometric analysis of β-cells from dissociated islets of 12-week old Clec16a+/+;mtKeima and Clec16acurt/curt;mtKeima mice, indicating the relative distribution of β-cells with mitochondria in dominantly acidic or neutral compartments following exposure to 250 nM valinomycin or DMSO control for 3 h. n = 4/group. *p < 0.05 **p < 0.01 ***p < 0.001.
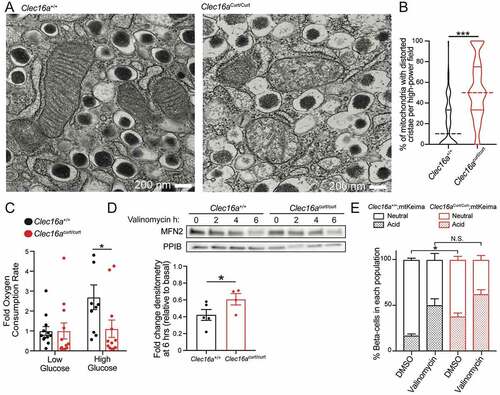
Figure 4. The CLEC16A C terminus regulates mitophagy in MEFs. (A) Representative flow cytometry univariate histogram depicting Mtphagy dye intensity from primary MEFs derived from Clec16a+/+ and Clec16acurt/curt mice. (B) Quantification of Mtphagy-high MEFs from Clec16a+/+ and Clec16acurt/curt mice, generated using flow cytometry histograms as indicated in Figure S5A. n = 4/group. (C) Representative flow cytometry scatter plot from Clec16a+/+ and Clec16acurt/curt MEFs following staining with Mtphagy and TMRE dyes. (D) Western blot of autophagy markers SQSTM1/p62 and LC3 in Clec16a+/+ and Clec16acurt/curt MEFs. n = 3/group. (E) Quantification of LAMP1 and OXPHOS colocalization in Clec16a+/+ and Clec16acurt/curt MEFs as shown in 4 F. n = 3 independent experiments/group. (6,604–16,528 LAMP1-positive and 8,923–20,774 OXPHOS-positive structures from 11–12 images were quantified per experiment per condition). (F) Representative deconvolved immunofluorescence images of Clec16a+/+ and Clec16acurt/curt MEFs at 100X magnification following exposure to 1 µM valinomycin for 6 h, stained for markers of mitochondria (OXPHOS; red) and lysosomes (LAMP1; green) as well as DNA (DAPI; blue). White arrowheads in magnified inset images highlight colocalized OXPHOS- and LAMP1-positive structures. *p < 0.05 **p < 0.01.
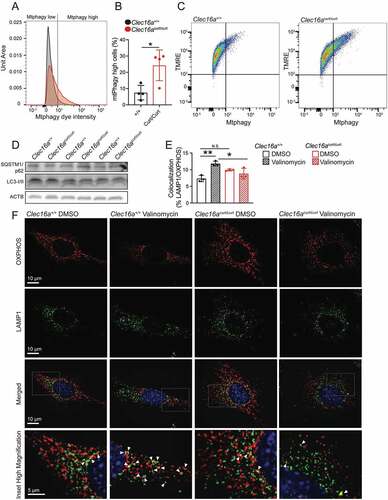
Figure 5. The CLEC16A C-terminal IDPR is required for mitophagy complex formation by maintaining CLEC16A stability. (A) Schematic of C-terminal Flag epitope-tagged constructs encoding wild-type (WT) full-length CLEC16A or CLEC16A lacking the C-terminal IDPR (∆C). (B) Representative Flag WB of WT and ∆C CLEC16A following transfection in 293 T cells. Arrow indicates CLEC16A ∆C band. PPIB serves as loading control. n = 4/group. (C) Relative Clec16a mRNA levels (normalized to Ppia expression) following transfection of Flag-EV, WT CLEC16A, or ∆C CLEC16A plasmids into 293 T cells. n = 3/group. (D) Representative WB of Flag-CLEC16A levels (with densitometry of % change from basal levels) from 293 T cells transfected with WT or ∆C CLEC16A following treatment with cycloheximide (CHX; 300 µg/mL) for 0–6 h. Similar levels of Flag-CLEC16A protein between groups were achieved by transfection with 1 µg of WT CLEC16A (with 4 µg Flag-EV) or 5 µg CLEC16A ∆C. n = 3–4/group. (E) Representative WB of cell-based ubiquitination assay of overexpressed Flag-tagged CLEC16A WT or ∆C performed in HEK293T cells co-transfected with MYC-Ubiquitin. Cells were treated with DMSO or 10 μM MG132 for 12 h. Similar levels of Flag-CLEC16A protein between groups were achieved by transfection of 1x WT (1.5 µg Flag-WT CLEC16A + 6 µg Flag-EV) or 5x ∆C (7.5 µg Flag-∆C). n = 3/group. (F) Representative WB of in vitro ubiquitination assay of recombinant CLEC16A-6xHis-Flag WT or ∆C following incubation with ATP, HA-Ubiquitin, E1, in the presence or absence of UBE2D3 at 37°C for 1 h. n = 4/group. (G) Representative WBs of cell-based assessment of binding, stabilization, and ubiquitination of overexpressed HA-tagged RNF41 by Flag-tagged CLEC16A WT or ∆C (or empty vector control) performed in HEK293T cells co-transfected with MYC-Ubiquitin. Conditions included Flag-EV (empty vector; 7.5 µg), 1x Flag-CLEC16A WT (1.5 µg Flag-CLEC16A WT + 6 µg Flag-EV), and 1x or 5x Flag-CLEC16A ∆C (1.5 µg Flag-CLEC16A ∆C + 6 µg Flag-EV or 7.5 µg Flag-CLEC16A ∆C, respectively). n = 3/group. (H) Representative WB following anti-Flag IP in HEK293T cells transfected with HA-RNF41, GFP-USP8 and Flag-EV, Flag-CLEC16A WT, or Flag-CLEC16A ∆C vectors. Conditions included Flag-EV (empty vector; 7.5 µg), 1x Flag-CLEC16A WT (1.5 µg Flag-CLEC16A WT + 6 µg Flag-EV), and 1x or 5x Flag-CLEC16A ∆C (1.5 µg Flag-CLEC16A ∆C + 6 µg Flag-EV or 7.5 µg Flag-CLEC16A ∆C, respectively). n = 3/group. *p < 0.05.
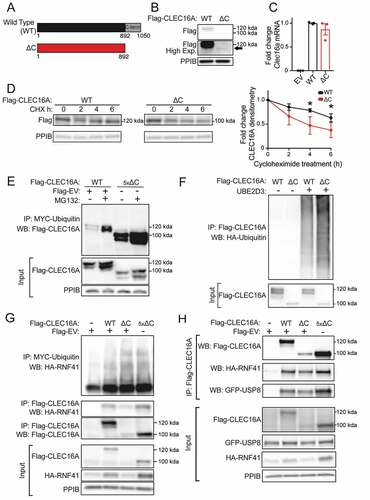
Figure 6. The human CLEC16A disease isoform is unstable and impairs mitophagy complex formation and β-cell function. (A) Representative Flag WB of full length human CLEC16A and the CLEC16A disease variant following transfection in 293 T cells. n = 3/group. (B) Representative WB of Flag-CLEC16A levels from 293 T cells transfected with a plasmid encoding full-length human CLEC16A or the CLEC16A disease variant CLEC16A following treatment with cycloheximide (CHX; 300 µg/mL) for 16 h. n = 3/group. (C) Representative WB of cell-based ubiquitination assay of overexpressed Flag-tagged CLEC16A or the CLEC16A disease variant performed in HEK293T cells co-transfected with MYC-Ubiquitin. Cells were treated with DMSO or 150 nM BafA for 12 h. Similar levels of Flag-CLEC16A protein between groups were achieved by transfection of the following plasmids encoding: 1x full-length CLEC16A (1.5 µg Flag-CLEC16A + 6 µg Flag-EV) or 5x CLEC16A disease variant (7.5 µg Flag-CLEC16A disease variant). n = 3/group. (D) Representative WB following endogenous RNF41 IP in HEK293T cells transfected with GFP-USP8 and Flag-EV, Flag-CLEC16A, or Flag-CLEC16A disease variant vectors. n = 3/group. (E) Representative WBs of cell-based assessment of binding and stabilization of overexpressed HA-tagged RNF41 by Flag-tagged CLEC16A full length, CLEC16A disease variant, CLEC16A ∆ internal, or CLEC16A alternative C terminus (or empty vector control) performed in HEK293T cells co-transfected with MYC-Ubiquitin. n = 3/group. (F) Representative CLEC16A WB of CLEC16A protein levels in scramble control (sgScr) or CLEC16A-deficient (sgClec16a) Min6 cells generated by CRISPR-mediated gene editing (with densitometry). (G) Representative CLEC16A WB of Min6 control and CLEC16A-deficient cells from (F) following transfection with Flag-CLEC16A, Flag-CLEC16A disease variant, or empty vector control into CLEC16A-deficient Min6 cells. (H) Glucose-stimulated insulin secretion (GSIS) assay performed in transfected Min6 cells from (G) 72 h after transfection with CLEC16A (or empty vector control) constructs, following static incubation in 2 mM or 20 mM glucose. n = 5/group. *p < 0.05.
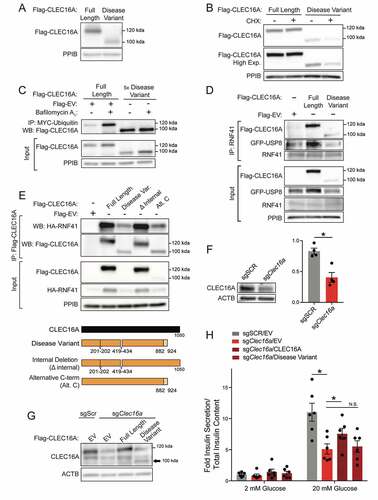
Figure 7. Proline bias within the CLEC16A C-terminal IDPR is necessary for CLEC16A stability. (A) Disorder propensity score for CLEC16A mutants as determined by IUPred2. (B) Representative Flag WB (with quantification by densitometry of all studies below) of Flag-CLEC16A WT, Flag-CLEC16A ∆C, as well as C-terminal IDPR mutants following transfection in 293 T cells. n = 4/group. C-terminal IDPR mutants include P-to-S (AA892-1050 proline to serine mutant), Alt. charge (alternate charge mutant), and Charge seg. (charge segregation mutant). (C) Net charge per-residue for listed CLEC16A mutants, calculated as an average net-charge per residue over a 5-residue “blob”. Kappa (K) scores indicates the degree to which charged residues are intermixed and were generated by CIDER (52). *p < 0.05. (D) Representative Flag WB (with quantification by densitometry of all studies below) of Flag-CLEC16A WT, Flag-CLEC16A ∆C, as well as C-terminal pan-lysine to arginine (K-to-R) or pan-serine to alanine (S-to-A) mutants following transfection in HEK293T cells. n = 3/group.
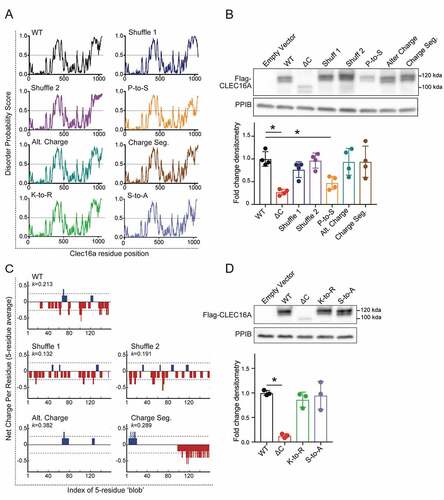
Table 1. Antibodies.