Figures & data
Figure 1. Epg5 knockout female mice are subfertile. (a) Immunoblotting of ovary samples for the EPG5 protein and ACTB (internal control). (b) Images of ovaries from control and epg5 knockout mice at 8 weeks. Scale bars: 2 mm. (c) The ovary-to-body weight ratio of the control and epg5 knockout mice. (d) Subfertility of female epg5 knockout mice. Both control (n = 5) and epg5 knockout (n = 5) females were mated with WT male mice; continuous breeding showed the cumulative number of progeny per female mouse. The asterisks indicate statistically significant differences. (e) the average litter size of control (n = 5) and epg5 knockout (n = 5) females. (f) Representative histology of ovaries sections from 16-week-old epg5 knockout females stained with hematoxylin and eosin. (g) Numbers of follicles at different stages in ovary sections from 16-week-old control and epg5 knockout mice (n = 4 for each group). Follicles were counted; black arrowheads in F point to follicles at different stages. PmF, primordial follicle; PF, primary follicle; SF, secondary follicle; AF, antral follicle. CL: Corpus luteum. Scale bars: 100 µm. Data are expressed as the mean ± S.E.M. *P < 0.05, **P < 0.01. ***P < 0.001.
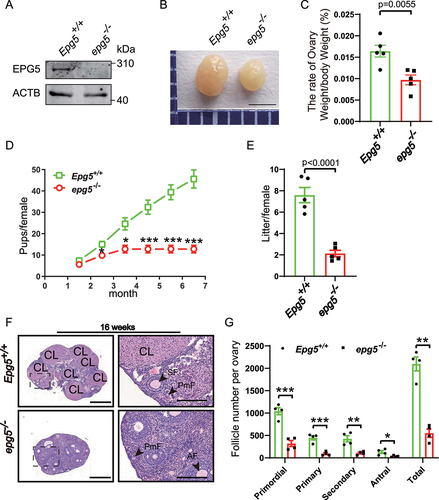
Figure 2. Oocytes from epg5 knockout mice are able to complete meiotic maturation. (a) The average number of ovulated eggs were evaluated in control and epg5 knockout mice (n = 7 for each group). (b) Quantitative analysis of first polar body (Pb1) extrusion rate in epg5 knockout and control (n = 234) oocytes. (c) Representative images of oocytes from WT and epg5 deficiency mice after 14 h culture. scale bars: 100 μm. Immature GV oocytes isolated from 3-week-old control and epg5 knockout mice were cultured in vitro to check the maturational progression. (d) Quantitative analysis of mii oocytes of control and epg5 knockout mice after 14 h culture. (e) Confocal microscopy results showing spindle assembly collected from cultured MII oocytes of control and epg5 knockout mice. (f) Quantitative analysis of abnormal MII with a deformed spindle and misaligned chromosomes. Scale bar: 20 μm. Data are expressed as mean ± S.E.M. n.s., nonsignificant.
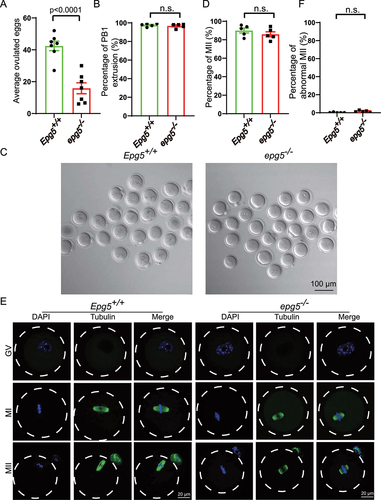
Figure 3. Epg5 knockout results in GCs aging and cell death. (a) Histoenzymatic detection of GLB1/β-gal. The blue indigo precipitates (resulting from X-Gal lysis by GLB1/β-gal) are evident in the GCs of 12-week-old epg5 knockout mice. The red asterisks indicate follicles positive for GLB1/β-gal signals. Scale bar: 200 µm. (b) Quantification of GLB1/β-gal-positive GCs in ovary sections (n = 5 for each of the indicated groups). (C) TUNEL assay to evaluated GC apoptosis in 12-week-old epg5 knockout and control ovaries. The white asterisks indicate follicles positive for TUNEL. Scale bars: 200 µm, 20 µm. (g) Quantitative analysis of TUNEL-positive cells of ovary sections in C (n = 4 for each group). (d) PCNA immunofluorescence assays and (h) the quantification of PCNA positive granulosa cells in epg5 knockout and control ovaries are shown (n = 4 for each group). Scale bars, 20 µm. (e) CASP3 Immunofluorescence analysis of epg5 knockout and control ovaries sections. Scale bars: 50 µm, 20 µm. (i) Quantitative analysis of CASP3-positive cells of ovary sections in E (n = 3 for each group). (f) γ-H2AX immunofluorescence assays and J the quantification of γ-H2AX positive GCs in epg5 knockout and control ovaries are shown (n = 5 for each group). Scale bars: 20 µm. Data are expressed as the mean ± S.E.M.
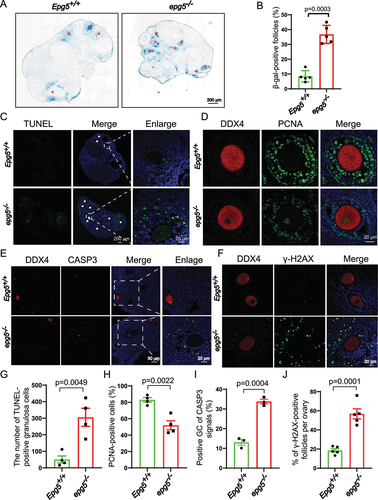
Figure 4. Accumulation of the autophagy maker LC3-II and SQSTM1 aggregates in epg5 knockout mice ovaries. (a) Immunoblotting for the LC3, SQSTM1 protein, and GAPDH (internal control) levels in ovaries. (b-c) Summary of quantification data from LC3 and SQSTM1 activity assays (relative to control). All experiments were repeated at least three times. (d) LC3 aggregates were accumulated dramatically in epg5 knockout GCs compared to the control groups. The white arrow shows LC3 puncta in antral follicular GCs. Scale bars: 5 µm, 7.5 µm, 10 µm, 25 µm. (e) SQSTM1 puncta aggregation was observed in the epg5 knockout GCs compared to the control groups. The white arrow shows SQSTM1 puncta in antral follicular GCs. Scale bars: 5 µm, 10 µm, 25 µm. (f) Immunoblotting for the LC3, SQSTM1 protein, and GAPDH (internal control) levels in GCs. (g-h) Summary of quantification data from LC3 and SQSTM1 activity assays (relative to control) in GCs. (i) GFP-LC3 puncta colocalize with Lysotracker puncta in control but not epg5 knockout GCs. Scale bars: 4 µm, 1 µm. (j) Quantification of the number of GFP-LC3 punctate structures in control and epg5 knockout GCs (n = 10 for each group). (k) In control cells, an LC3 punctum (arrows) originally associates with Lysotracker puncta structures, while in epg5 knockout GCs, an LC3 punctum did not fusion with Lysotracker punctum. Scale bars: 1 µm. (l) The percentage of LC3-stained puncta colocalizing with Lysotracker punctate structures in control and epg5 knockout GCs (n = 10 for each group). All experiments were repeated at least three times. PmF, primordial follicle; PF, primary follicle; SF, secondary follicle; AF, antral follicle. Data are expressed as the mean ± S.E.M.
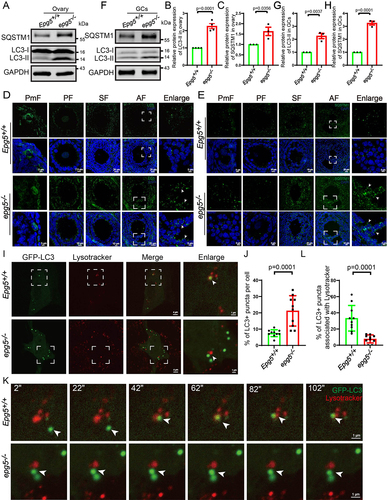
Figure 5. Single-cell RNA-seq analysis uncovers altered functions in epg5 knockout GCs. (a) Schematic representation of ovarian tissue preparation for the single-cell transcriptome analysis. (b) Heatmap showing the expression levels of DEGs in GCs. (c) GO enrichment showing the terms associated with downregulated genes (with adjusted P value lower than 0.01) from epg5 knockout GCs. (d) Regulatory network visualizing potential key transcriptional regulators in DEGs in GCs. The node size indicates the number of target genes associated with corresponding transcription factor. The edge size indicates the weight of the connection. (e) Immunoblotting for the BCLAF1, ATF4, FOS, WT1, JUN and FOXO1 protein, and TUBA (internal control) levels in ovaries. (f-k) Summary of quantification data from E. All experiments were repeated at least three times. Data are expressed as the mean ± S.E.M. n.s., nonsignificant.
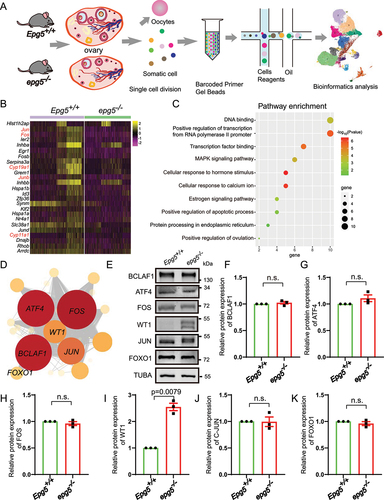
Figure 6. The degradation of WT1 in GCs dependents on autophagy. (a) WT1 immunofluorescence of isolated 6-week-old epg5 knockout and control GCs. Scale bars: 20 µm. (b) Immunoblotting for the WT1 protein, and GAPDH (internal control) levels in 6-week-old GCs. (c) Quantification of WT1 protein relative to control in 6-week-old GCs. (d) Immunoblotting for the WT1 protein, and GAPDH (internal control) levels in 2-week-old ovaries. (e) Immunoblotting for the WT1 protein, and GAPDH (internal control) levels in 3-week-old eCG/PMSG-treated ovaries. (f) Quantification of WT1 protein relative to control in D (n = 3 for each group). (g) Quantification of WT1 protein relative to control in F (n = 3 for each group). (h) Treatment with the autophagy/lysosome inhibitor 3-MA resulted in the accumulation of WT1. CHX chase assay of WT1 in HEK293T cells in the absence or presence of 3-MA. (I) Quantification of the relative WT1 levels in panel G. (J) WT1 interacts with SQSTM1. pCMV-tag2b-FLAG-Wt1 and pMXs-puro-GFP-SQSTM1, pMXs-IP-GFP-NBR1(38,283), pEGFP-TOLLIP, or pEGFP-LC3 were co-transfected into HEK293T cells. 24 h after transfection, cells were collected for IP with an anti-GFP antibody and then analyzed via blotting with an antibody against GFP. (k) Immunofluorescence staining of WT1 (green) and SQSTM1 (red) of epg5 knockout and WT ovaries sections. The white arrow shows WT1 (green) and SQSTM1 (red) puncta respectively in antral follicular GCs. The yellow arrow shows the co-localization of WT1 (green) and SQSTM1 (red) puncta in antral follicular GCs. PmF, primordial follicle; PF, primary follicle; SF, secondary follicle; AF, antral follicle. Scale bars: 5 µm, 10 µm, 20 µm. Data are expressed as the mean ± S.E.M. *P < 0.05.
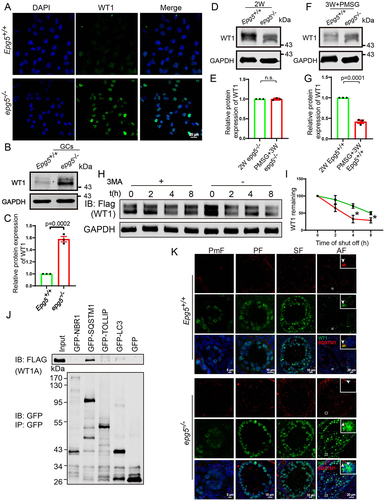
Figure 7. Wt1 knockdown partially rescue the expression of steroidogenic genes in epg5 knockout GCs.
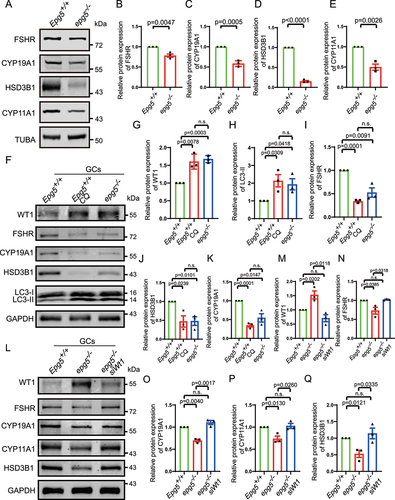
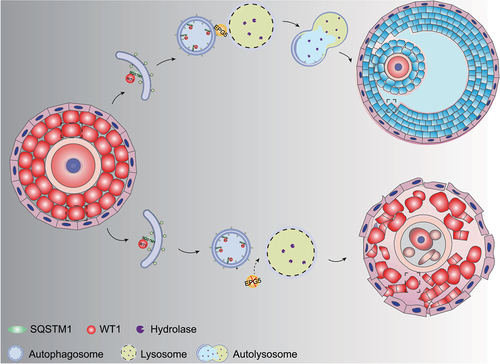
Figure 8. A model for EPG5ʹs function in regulating WT1 degradation during granulosa cell differentiation. In the presence of EPG5, autophagosomes can fuse specifically with late endosomes/lysosomes, after which autophagy facilitates WT1 degradation, ultimately leading to successful differentiation of GCs in the antral follicle stage.