
Figures & data
Figure 1. Synaptic activity induces TFEB trafficking to the nucleus in primary cultured neurons. (A) Tg cultured neurons were transfected with TFEB-GFP and stimulated by gLTP. The sequence of images, acquired every 3 min, showed the progressive entrance of TFEB-GFP into the nucleus, resulting in its increased fluorescence (scale bars: 10 μm). (B) Quantitative analysis showing significantly increased TFEB-GFP fluorescence levels within the nucleus after stimulation, by 55 ± 21% and 63 ± 20% at 15 and 18 min respectively, compared to time 0 min (n = 3; repeated measures ANOVA p = 0.0018, followed by Dunnett’s multiple comparison test, 0 min vs 15 min *p < 0.05, 0 min vs 18 min *p < 0.05). (C) Quantification of cytoplasmatic levels of TFEB-GFP fluorescence showing a decreasing trend after stimulation compared to time 0 min (n = 3; repeated measures ANOVA p = 0.06, followed by Dunnett’s multiple comparison test, p > 0.05). (D-F) Quantification of endogenous TFEB showing 67 ± 8% reduction in the cytoplasm and 67 ± 17% increase in the nucleus of stimulated (gLTP) compared to control (CTRL) neurons (n = 3; two-tailed unpaired t-test, *p < 0.05). (G) Western blot analyses demonstrated reduction of phospho-TFEB (Ser142) in gLTP compared to CTRL Tg neurons. Phospho-TFEB was normalized with total TFEB. (H) Quantitative analysis showed that levels of phospho-TFEB are reduced by 78 ± 9% in gLTP compared to CTRL Tg neurons (n = 4–5; two-tailed unpaired t-test, *p < 0.05). (I) Western blot analyses demonstrated reduction of phospho-EIF4EBP1 and increased phospho-CAMK2 in gLTP compared to CTRL Tg neurons. Phospho-EIF4EBP1 and phospho-CAMK2 were normalized with total EIF4EBP1 and total CAMK2, respectively. (J) Increased levels of phospho-CAMK2 (104 ± 25%) indicate the activation of neurons by gLTP (n = 4–5; two-tailed unpaired t-test, *p < 0.05). (K) Quantitative analysis showed that levels of phospho-EIF4EBP1 are reduced of 36 ± 17% in gLTP compared to CTRL Tg neurons (n = 5; two-tailed unpaired t-test, *p < 0.05). (L, M) gLTP significantly reduced levels of phospho-RPS6 of 33 ± 6% compared to control in Tg neurons, as quantified by confocal immunofluorescence (n = 3; two-tailed unpaired t-test, * p < 0.05; scale bar: 10 μm).
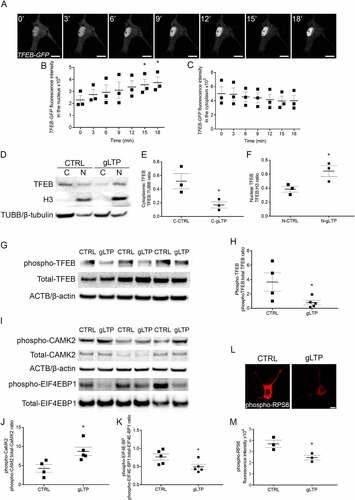
Figure 2. TFEB trafficking to the nucleus is required for activity-dependent reduction of pathological MAPT/Tau in Tg neurons. (A) gLTP induced a significant 44 ± 13% increase of TFEB-GFP in the nucleus of transfected Tg neurons (central panel, green) compared to CTRL (left panel, green). Tg neurons were co-transfected with TFEB-GFP together with a constitutively active mutant RRAGCS75L (right panels, red and merged). Upon gLTP, entrance of TFEB into the nucleus of RRAGCS75L positive neurons was abolished (right panel, green), as quantified in (B) (n = 3–4; one-way ANOVA test, p = 0.0002, followed by Tukey’s multiple comparison post-hoc test: CTRL vs gLTP *p < 0.05, gLTP vs gLTP+RRAGCS75L ###p < 0.001). (C, D). gLTP induced a 59 ± 6% reduction of MAPT/Tau oligomers in RRAGCQ120L compared to CTRL Tg neurons. Prevention of TFEB entrance in the nucleus by transfection with RRAGCS75L abolished activity-dependent clearance of MAPT/Tau oligomers as quantified by confocal immunofluorescence in D (n = 3–5; one-way ANOVA, p = 0.0008 followed by Tukey’s multiple comparison test: CTRL vs gLTP RRAGCQ120L ***p < 0.0001, CTRL vs RRAGCS75L **p < 0.01, gLTP+RRAGCQ120L vs gLTP+RRAGCS75L ###p < 0.001, gLTP+RRAGCQ120L vs RRAGCQ120L ###p < 0.001, gLTP+RRAGCQ120L vs RRAGCS75L ###p < 0.001). (E, F) Transfection with TFEB-GFP reduces levels of MAPT/Tau oligomers (−31 ± 3%) in Tg neurons (CTRL-GFP, left panels, white arrowheads) compared to CTRL. gLTP stimulation reduces MAPT/Tau oligomers (−28 ± 5%) both in Tg neurons transfected with TFEB-GFP (gLTP-GFP, right panels, white arrowhead) and untransfected Tg neurons (−28 ± 4%, gLTP; n = 3; one-way ANOVA, p = 0.0007 followed by Tukey’s multiple comparison test: CTRL vs CTRL-GFP ***p < 0.001, CTRL vs gLTP **p < 0.01, CTRL vs gLTP-GFP **p < 0.01). Scale bars: 10 μm.
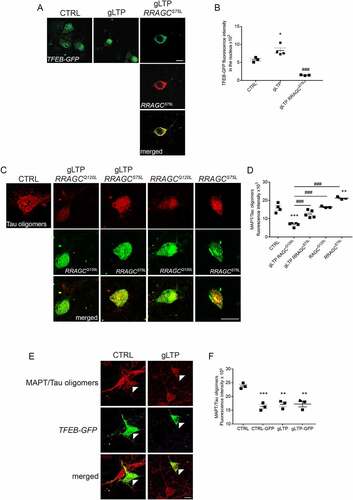
Figure 3. Synaptic activation triggers TFEB downstream gene expression. (A-E) Quantitative RT-PCR revealed an increase of 81 ± 27% of Mcoln1 (n = 4), 81 ± 31% of ATP6V0D1 (n = 3–4), 62 ± 17% of ATP6V1H (n = 4–5), 107 ± 39% of ATP6V1D (n = 4), and 65 ± 24% of Sqstm1 (n = 6) transcripts in gLTP-stimulated compared to CTRL neurons (two-tailed unpaired t-test, *p < 0.05). (F, G) Western blot analyses demonstrated that synaptic activity augmented of 48 ± 10% levels of MCOLN1 in gLTP-stimulated compared to CTRL Tg neurons (n = 3–4; two-tailed unpaired t-test, *p < 0.05). (H, I) Western blot analyses demonstrated that synaptic activity augmented of 116 ± 35% levels of ATP6V0D1 in gLTP-stimulated compared to CTRL Tg neurons (n = 4–5; two-tailed unpaired t-test, *p < 0.05). (J-L) Western blots analyses demonstrated a 44 ± 1% and a 41 ± 4% reduction of TFEB protein in TFEB-siRNA-transfected and gLTP+TFEB-siRNA-transfected neurons, respectively, compared to CTRL (upper panel; n = 3; one-way ANOVA test, p = 0.0048, followed by Tukey’s multiple comparison post-hoc test: CTRL vs gLTP+TFEB-siRNA *p < 0.05, CTRL vs TFEB-siRNA *p < 0.05, gLTP vs gLTP+TFEB-siRNA #p < 0.05, gLTP vs TFEB-siRNA #p < 0.05). gLTP increased significantly levels of ATP6V0D1 (43 ± 17%) in Tg neurons as compared to CTRL; ATP6V0D1 protein levels were significantly reduced by TFEB silencing (−70 ± 6%) as compared to control, even in the presence of gLTP (−66 ± 3%; n = 3; one-way ANOVA test, p < 0.0001, followed by Tukey’s multiple comparison post-hoc test: CTRL vs gLTP *p < 0.05, CTRL vs gLTP+TFEB-siRNA **p < 0.01, CTRL vs TFEB-siRNA **p < 0.01, gLTP vs gLTP+TFEB-siRNA ###p < 0.001, gLTP vs TFEB-siRNA ###p < 0.001). (M, N) Transfection of Tg neurons with TFEB-siRNA prevented gLTP-induced decrease of MAPT/Tau oligomers (third panel), which was maintained in untransfected neurons (second panel, −60 ± 7%). (n = 3, one-way ANOVA, p = 0.0164, Tukey’s multiple comparison test: CTRL vs gLTP *p < 0.05; gLTP vs gLTP+TFEB-siRNA # p < 0.05; gLTP vs TFEB-siRNA #p < 0.05; scale bar: 10 µm).
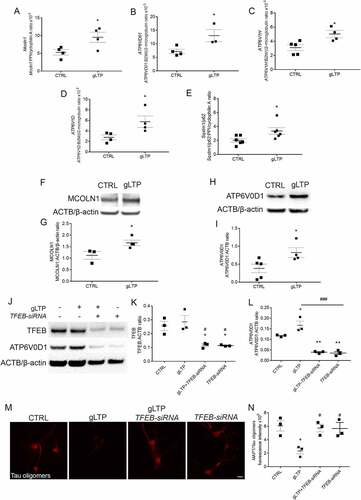
Figure 4. Synaptic activation restores levels of ATP6V0D1 and its lysosomal localization. (A, B) Western blot analyses showed higher (369 ± 120%) levels of phospho-MAPK in Tg-NS compared to WT-NS hippocampi; DBS restored levels of phospho-MAPK in Tg-S mice back to WT-NS levels (n = 3,4; one-way ANOVA test, p = 0.022, followed by Tukey’s multiple comparison post-hoc test: WT-NS vs Tg-NS *p < 0.05; Tg-NS vs Tg-S #p < 0.05). (C-E) Levels of phospho-TFEB (upper panel) were reduced by 69 ± 3% and 75 ± 4% in Tg-S and WT-S, respectively, compared to Tg-NS 3xTg mouse hippocampi (E), while levels of total TFEB (D) remained unchanged (n = 3–4; one-way ANOVA p = 0.0093, Tukey’s multiple comparison test: WT-S vs Tg-NS #p < 0.05, Tg-NS vs Tg-S #p < 0.05). (F, G) Levels of SQSTM1/p62 were increased by 150 ± 39% in Tg-NS compared to WT-NS mouse hippocampi, while in Tg-S levels of SQSTM1/p62 were restored back to WT-NS (n = 3; one-way ANOVA p = 0.0154, Tukey’s multiple comparison test: WT-NS vs Tg-NS *p < 0.05, Tg-NS vs Tg-S #p < 0.05). (F, H) Levels of ATP6V0D1 were decreased of 54 ± 6% in Tg-NS compared to WT-NS mouse hippocampi, while in Tg-S levels of ATP6V0D1 were restored back to WT-NS (n = 3–4; one-way ANOVA p = 0.002, Tukey’s multiple comparison test: WT-NS vs Tg-NS *p < 0.05; Tg-NS vs Tg-S ##p < 0.01). (I-K) Confocal immunofluorescence showed that Tg-NS hippocampal neurons had a 26 ± 4% decrease in size puncta areas of ATP6V0D1 (upper panels) compared to WT; DBS was able to restore ATP6V0D1 puncta areas in Tg-S back to WT-NS mice (n = 4–5; one-way ANOVA test p = 0.0184 followed by Tukey’s multiple comparison test WT-NS vs Tg-NS *p < 0.05, Tg-NS vs Tg-S #p < 0.05). Quantification of ATP6V0D1 and LAMP1 colocalization (lower panels, white arrows) revealed a 31 ± 7% decrease of colocalizing puncta in Tg-NS compared to WT-NS. DBS restored the number of ATP6V0D1 and LAMP1 colocalizing puncta in Tg-S hippocampal neurons back to WT-NS (n = 4–5; one-way ANOVA p = 0.0096 followed by Tukey’s multiple comparison test: WT-NS vs Tg-NS *p < 0.05, Tg-S vs Tg-NS #p < 0.05; scale bar: 10 μm).
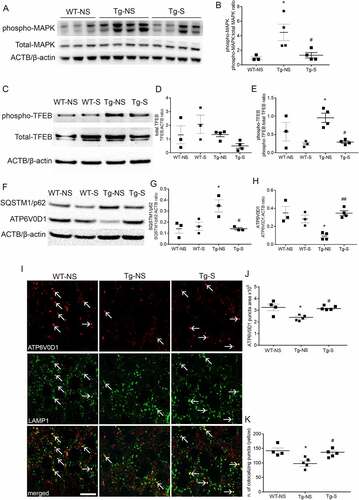
Figure 5. DBS reduces levels of phospho-MAPT/Tau and increases neuronal viability in PD patients. (A) Immunostaining of phospho-MAPT/Tau with AT8 antibody was performed in the GPi of PD patients who underwent STN stimulation (DBS, right panel; scale bar: 200 μm) or unstimulated controls (CTRL, left panel). Phospho-MAPT/Tau immunostaining is evident in somas (yellow arrows) and neurites (white arrow heads). (B) Quantification of AT8 immunostaining demonstrated about 100% decrease of phospho-MAPT/Tau positive somas in DBS patients compared to CTRL (n = 3; two-tailed unpaired t-test, ***p < 0.001). (C) Significant decrease, 0,3 ± 0,03 U/mL (-25 ± 3%), of phospho-MAPT/Tau Thr231 quantified by ELISA test in DBS-treated PD patients compared to CTRL (n = 3; two-tailed unpaired t-test, *p < 0.05). (D) A 5,12 ± 0,8/mm2 (+43 ± 7%) increased number of neurons was measured in DBS compared to CTRL GPi (n = 3; two-tailed unpaired t-test, *p < 0.05). (E) Immunostaining of SQSTM1/p62 in GPi of PD controls (CTRL, upper panels) and DBS (lower panels; scale bars: 100 μm; higher magnification: 25 μm). Higher magnification panels (right) show a 126 ± 42% increased number of SQSTM1 puncta (quantification in F; n = 3; two-tailed unpaired t-test, *p < 0.05), and a 16 ± 4% decreased size of puncta area (μm2) in DBS-stimulated neurons compared to control (quantification in G; n = 3; two-tailed unpaired t-test, *p < 0.05). (H, I) Immunofluorescence showing increased levels of MCOLN1 (+87 ± 20%) in the GPi of DBS-treated PD patients compared to CTRL (n = 3; two-tailed unpaired t-test, *p < 0.05; scale bar: 100 μm).
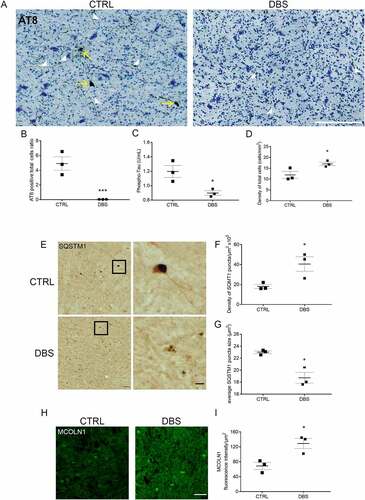
Table 1. Demographics and severity of the PD control and PD DBS groups. UPDRS: Unified Parkinson’s Disease Rating Scale; H&Y: Hoehn and Yahr Scale.