
Figures & data
Figure 1. Depletion of PEX13 results in decreased peroxisome numbers. (A) HeLa cells were transfected with siRNA against PEX1, PEX2, PEX3, PEX5, PEX6, PEX10, PEX12, PEX13, PEX14, PEX19, PEX26 as well as a non-targeting control siRNA (siCTRL). Cells were fixed and immunostained for endogenous peroxisome marker ABCD3. Scale bar: 25 μm (B) Graph of ABCD3 density of images in (A). (n = 3; 30 cells/trial). Error bars represent standard deviation. (C) HeLa cells treated with siCTRL or siPEX13, overexpression WT PEX13-MYC, W313G or I326T, stained anti-MYC and anti-ABCD3. Scale bar: 10 μm. (D) Quantification of images in (C) (n = 3; >30 cells/trial). Error bars represent standard deviation. Asterisks denote p-values compared to siCTRL: *p < 0.05, **p < 0.01.
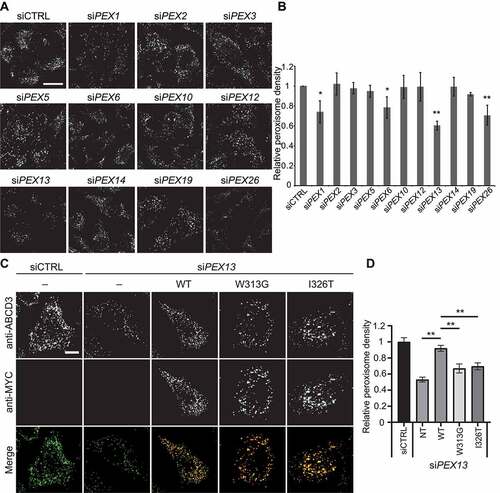
Figure 2. PEX13-mediated peroxisome loss is an autophagic process. (A) Wild type and atg5−/− mouse embryonic fibroblasts (MEFs), transfected with control siRNA (siCTRL) or siPEX13, fixed and immunostained for endogenous ABCD3. (B) Graph of ABCD3 density from images in (A) (n = 3; 30 cells/trial). Error bars represent standard deviation. (C) Wild type, ATG5 knockout and ATG7 knockout HeLa cells stained for endogenous ABCD3. (D) Immunoblot analysis of wild type and ATG5 knockout HeLa cells treated with either siCTRL or siPEX13, probed for the indicated proteins. (E) HeLa cells transfected with non-targeting siRNA (siCTRL) or siPEX13 alone, or siPEX13 co-treated with siATG12, siNBR1, siPEX2 or siPEX5, fixed and immunostained for endogenous ABCD3. (F) Graph of ABCD3 density from images in (E) (n = 3; 30 cells/trial). Error bars represent standard deviation. Asterisks denote p-values: *p < 0.05, **p < 0.01. Scale bars: 25 μm (A and E), 10 μm (C).
Figure 3. PEX13 depletion increases membrane localization and ubiquitination of PEX5. (A) HeLa cells transfected with siCTRL, siPEX1, siPEX13, or siPEX14, fixed and stained for endogenous PEX5 (red) and ABCD3 (green). Prior to fixation cells were treated with 0.025% digitonin for 10 seconds to permeabilize the plasma membrane and washed with PBS. (B) Quantification of images in (A). Pearson’s correlation coefficient between PEX5 and ABCD3 was calculated (n = 3; 30 cells/trial). Error bars represent standard deviation. (C) Quantification of PEX5 on peroxisomes (A). Normalized mean fluorescent intensity of PEX5 within ABCD3 structures was calculated (n = 3; 30 cells/trial). Error bars represent standard deviation. (D) Flp-In T-Rex HEK293 cells stably expressing HA-tagged ubiquitin were transfected with siCTRL, siPEX13 or siPEX14 and treated with HCQ (10 μM) and doxycycline (1 μM) for 24 h. 3 h prior to lysis cells were treated with MG132 (10 μM). Immunoprecipitation (IP) with an antibody against the HA epitope tag was performed. Lysates and IP samples were separated by SDS-PAGE and probed for PEX5. (E) Immunofluorescent images of HeLa cells transfected with siCTRL or siPEX13 and co-transfected with USP30-Flag, fixed and stained for ABCD3 (red) and Flag (green). (F) Graph of ABCD3 density from images in (E) (n = 3; 30 cells/trial). Error bars represent standard deviation. (G) Immunoprecipitation of HA-ubiquitin in cells treated with the indicated siRNA as in D, however IP samples were treated with or without 5 mM BME and assessed on non-reducing SDS-PAGE. Full immunoblot of anti-PEX5 is presented in Figure S3B. Scale bars: 25 μm (A), 20 μm (F). Asterisks denote p-values; *p < 0.05, **p < 0.01.
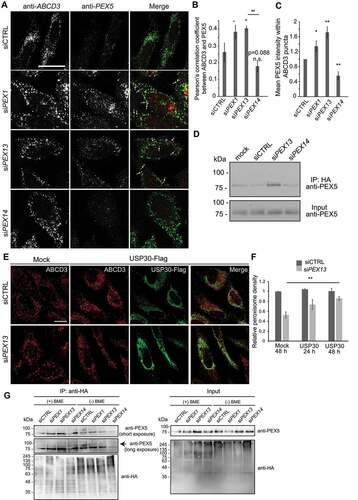
Figure 4. Peroxisome number is reduced in the pex13 mutant zebrafish liver and is partially rescued by chloroquine treatment. (A) Peroxisomes detected in wild type (WT) or pex13 mutant (pex13−/−) liver sections either stained with endogenous Abcd3 (upper row) or obtained from a transgenic zebrafish expressing RFP-SKL (lower row), at 5 dpf with and without CQ treatment for 24 h. (B) Quantification of images in (A). Relative abundance and colocalization of RFP-SKL-positive particles or Abcd3-positive particles in livers of WT and pex13−/− with and without CQ treatment were compared (n = 8; approximately 30–40 cells per liver section). Error bars represent standard deviation. (C) Representative images and their quantification from the liver sections of WT or pex13−/− with and without CQ treatment after staining with Oil red-O (ORO). Asterisks denote p-values; *p < 0.05. Scale bar: 10 μm (A), 40 μm (C).
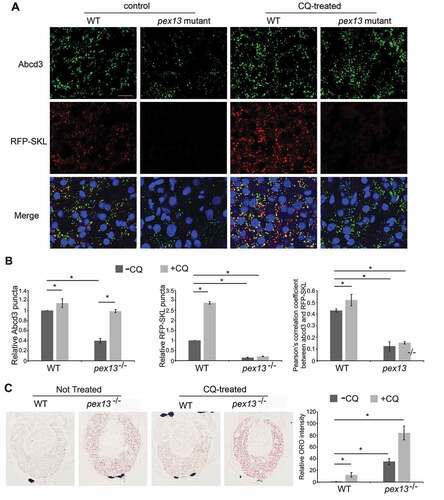
Figure 5. PEX1 and PEX13 depletion induces autophagy, decreases CAT localization to peroxisomes and increases cellular ROS. (A) HeLa cells over-expressing GFP-MAP1LC3B, transfected with siCTRL, siPEX1, siPEX13, siPEX14 alone, or co-transfected with siNBR1. (B) Quantification of images in (A). The number of cells with more than 10 GFP-MAP1LC3B puncta were compared between the siRNA treatments (n = 3; 30 cells/trial). Error bars representing standard deviation. (C) Immunofluorescent images of HeLa cells treated with the indicated siRNAs stained for endogenous catalase (red) and ABCD3 (green). (D) Quantification of mean catalase intensity within ABCD3 structures of images in (A) (n = 3; 30 cells/trial). Error bars represent standard deviation. (E) Membrane fractionation of HEK293 cells treated with indicated siRNA, probed for catalase and ABCD3. Cyto denotes cytosolic fraction, Meb denotes membrane fraction. (F) Live cell images of HeLa cells treated with indicated siRNA and ROS probe OxyBURST. (G) Quantification of mean fluorescent intensity of images in (F) (n = 3; 30 cells/trial). Error bars representing standard deviation. Asterisks denote p-values; *p < 0.05, **p < 0.01. Scale bars: 10 μm (A), 25 μm (C), 50 μm (F).
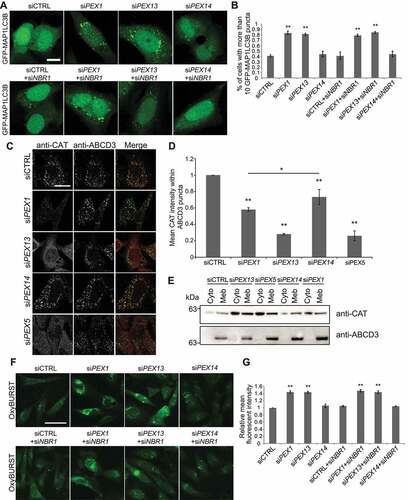
Figure 6. N-acetyl cysteine treatment to PEX1 and PEX13 depleted cells decreases GFP-MAP1LC3B puncta and increases peroxisome abundance but does not change ubiquitination of PEX5. (A) Immunofluorescent images of HenLe cells stably expressing GFP-MAP1LC3B treated with the indicated siRNA and NAC (10 μM) where indicated. Cells were fixed and immunostained for ABCD3 (red). (B) Quantification of GFP-MAP1LC3B density of (A). (n = 3; 30 cells/trial). Error bars represent standard deviation. (C) Quantification of ABCD3 density of (A). (n = 3; 30 cells/trial). Error bars represent standard deviation. (D) Live cell images of HeLa cells treated with the indicated siRNA and ROS probe OxyBURST. (E) Quantification of mean fluorescent intensity of images in (D) (n = 3; 30 cells/trial). Error bars represent standard deviation. (F) IP analysis of HEK293 cells stably expressing HA-ubiquitin. Cells were treated with the indicated siRNA and NAC where indicated. Asterisks denote p-values; *p < 0.05, **p < 0.01. Scale bars: 25 μm (A), 50 μm (D).
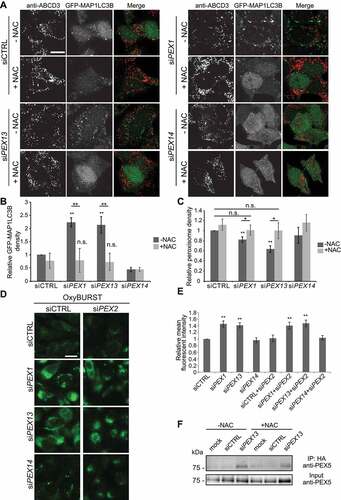
Figure 7. Peroxisome targeted catalase diminishes ROS observed with PEX1 and PEX13 depletion. (A) Live cell images of HeLa cells treated with the indicated siRNA and expressing the indicated CAT constructs and visualized with ROS probe CellROX Orange. (B) Quantification of mean fluorescent intensity of (D) (n = 3; 30 cells/trial). Error bars represent standard deviation. Asterisks denote p-values; *p < 0.05, *p < 0.01. Scale bar: 50 μm.
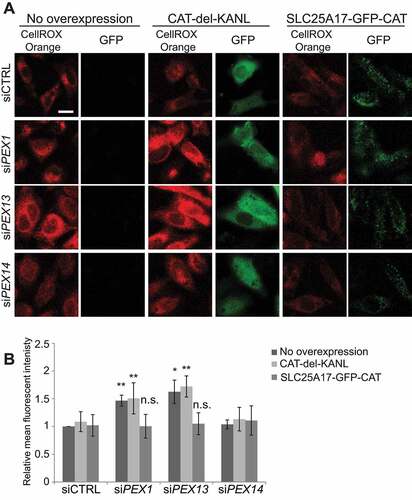
Figure 8. PEX13 protein levels are proteasomally regulated during MTORC1 inhibited pexophagy. (A) Immunoblot analysis of HEK293 cells grown in HBSS for the indicated time, probed for PEX13, ACOX1 and ACTB/β-actin. Asterisks indicate residual ACOX1 band. (B) Quantification of relative protein levels of PEX13 and ACOX1 from (A) (n = 3). (C) Immunoblot analysis of HEK293 cells treated with HBSS and MG132 (10 μM) for 4 h as indicated, and probed for PEX13, ACOX1 and ACTB/β-actin. (D) Quantification of relative protein levels of PEX13 and ACOX1 from (C) (n = 4). (E) Immunoblot analysis of HEK293 cells treated with siCTRL and siPEX2, and HBSS as indicated and probed for PEX13 and VCL/vinculin. (F) Quantification of the relative protein levels of PEX13 in (E). (G) Immunofluorescent images of HeLa cells overexpressing the indicated PEX13-MYC constructs (green) and stained for endogenous ABCD3 (red), treated with HBSS for 24 h as indicated. (H) Quantification of peroxisome density in (G) (n = 3; >30 cells/trial). Error bars represent standard deviation. Asterisks denote p-values; **p < 0.01, ns p > 0.05. Scale bar: 10 μm.
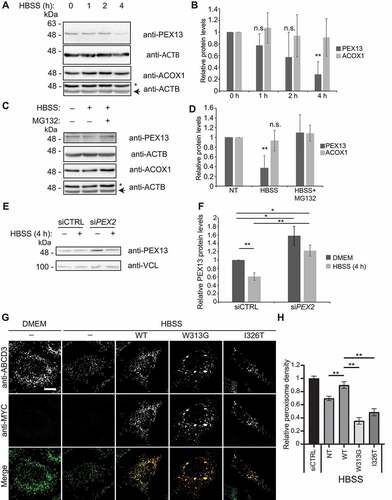
Figure 9. Model of PEX13 induction of pexophagy. In this model, we propose that the loss of PEX13 3 (∆PEX13) promotes pexophagy by i) the accumulation of ubiquitinated PEX5 on the peroxisomal membrane that recruits autophagy receptors and ii) increasing cellular ROS levels to upregulate autophagosome formation. PEX13-dependent pexophagy can be observed during amino acid starvation or when MTORC1 is pharmaceutically inhibited.
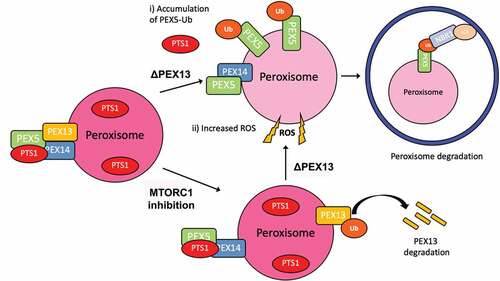
Table 1. List of the oligonucleotide primers used.
Table 2. List of the forward sequences of siRNA used in the study.
Table 3. List of the antibodies used in the study.