
Figures & data
Figure 1. Protein and mRNA expression of autophagy and UPR genes is dysregulated in A/A cells during ER stress. (A) WB analysis of UPR proteins in lysates of S/SHep and A/AHep cells treated with Tm (1 µg/mL) for the indicated durations. ATF6(F): full-length glycosylated ATF6; ATF6(F*): full-length unglycosylated ATF6; ATF6(N): cleaved N-terminal fragment of ATF6; ATF6B(F): full-length glycosylated ATF6B; ATF6B(F*): full-length unglycosylated ATF6B; ATF6B(N*) and ATF6B(N): cleaved N-terminal fragments of ATF6B. The identities of bands indicated in the ATF6 and ATF6B WB analysis were validated by WB analysis (Fig. S1) of atf6 KO and atf6 atf6b double KO cell lines using the same ATF6- and ATF6B-specific antibodies. (B and C) Quantitative RT-PCR analysis of mRNA expression of ER stress response (B) and autophagy (C) genes in S/SHep and A/AHep cells treated with Tm (1 µg/mL) for the indicated durations. Data are presented as mean ± SEM of three independent experiments (two-way ANOVA with Sidak’s post hoc test) (D) WB analysis of autophagy proteins in lysates of S/SHep and A/AHep cells treated with Tm (1 µg/mL) for the indicated durations. CTSB: cathepsin B; CTSL: cathepsin L; Pro: procathepsin; Sc: mature single-chain cathepsin; Dc: heavy chain of mature double-chain cathepsin.
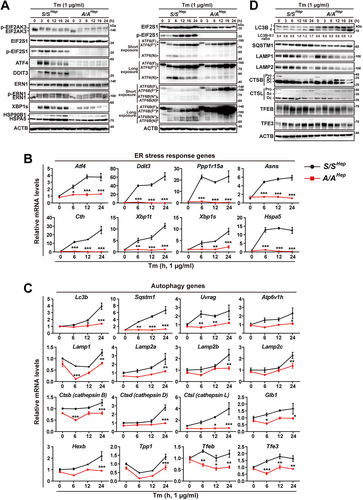
Figure 2. Autophagy is impaired in A/A cells during ER stress. (A) Representative IF images of LC3A/B in S/SHep and A/AHep cells treated with DMSO (vehicle) or Tm (1 µg/mL) for 24 h. The dotted white line defines the cell boundary. Scale bar: 20 µm. The graph depicts the fraction (%) of cells with different LC3A/B staining patterns (the “punctate” group represents cells with LC3A/B-positive puncta only, the “punctate + accumulated” group represents cells with both LC3A/B-positive puncta and condensed LC3A/B staining in the perinuclear region, the “accumulated” group represents cells with condensed LC3A/B staining only in the perinuclear region, and “no punctate + no accumulated” represents cells with neither LC3A/B-positive puncta nor condensed LC3A/B staining in the perinuclear region). Data are presented as mean ± SEM of three independent experiments (at least 150 cells per condition). (B) Representative IF images of an autophagosome marker (LC3A/B, green) and an ER marker (KDEL, red) in S/SHep and A/AHep cells treated with DMSO or Tm (1 µg/mL) for 24 h. Nuclei were stained with DAPI (blue). Scale bar: 20 µm. (C–E) Representative IF images of an autophagy marker (LC3A/B) or a cargo marker (SQSTM1) and a lysosome marker (LAMP1) in S/SHep and A/AHep cells treated with DMSO or Tm (1 µg/mL) for 24 h. Cells were fixed and costained with anti-LC3A/B (green) and anti-SQSTM1 (red) antibodies in (C), anti-SQSTM1 (green) and anti-LAMP1 (red) antibodies in (D), and anti-LC3A/B (green) and anti-LAMP1 (red) antibodies in (E). Nuclei were stained with DAPI (blue). The right panels are magnified images of the boxes in the left panels. Scale bars: left panels (20 µm) and right panels (10 µm). (F) Quantification of the colocalization of LC3A/B with SQSTM1 in (C) and LAMP1 with SQSTM1 or LC3A/B in (D and E). (G) Representative LysoTracker staining images of S/SHep and A/AHep cells. Cells were treated with Tm (1 µg/mL) for the indicated durations and stained with LysoTracker (100 nM, red) and Hoechst 33,258 (10 μg/mL, blue) for the last 30 min of the treatment. The dotted white line defines the cell boundary. Scale bar: 20 µm. (H) Quantification of the mean fluorescence intensity (MFI) of LysoTracker in (G). Data in the graphs in (F) and (H) are presented as mean ± SEM of three independent experiments (at least 150 cells per condition). A two-way ANOVA with Sidak’s post hoc test was used in the graphs in (F) and (H).
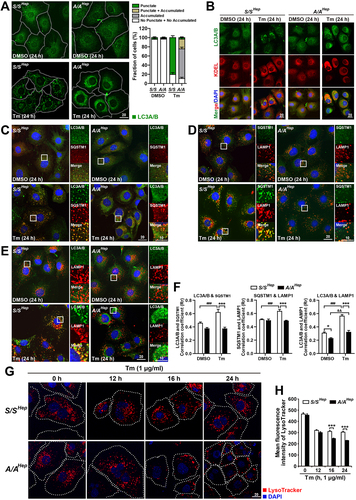
Figure 3. Autophagic flux is impaired in A/A cells during ER stress. (A) Representative TEM images of S/SHep and A/AHep cells treated with DMSO or Tm (1 µg/mL) for 24 h. The panels of the second (red) and third (yellow) rows are magnified images of the red and yellow boxes in the panels of the first row, respectively. Green arrowheads indicate autophagosomes, red arrowheads indicate autolysosomes, and yellow arrows indicate the ER. The dotted yellow line defines a mass of dilated and fragmented ER structures. Scale bars: first row 2 µm and second and third rows 0.5 µm. (B) Quantification of the number of autolysosomes per cell in the TEM images in (A). Data are presented as mean ± SEM of three independent experiments (at least 15 cells per condition). (C) WB analysis of LC3B in protein lysates of S/SHep and A/AHep cells. Cells were treated with DMSO or Tm (1 µg/mL) for 16 h in the absence or presence of the lysosomal inhibitor Baf A1 (200 nM) for 3 h before harvest. The graph depicts the LC3B-II level normalized to the ACTB level. Data are presented as mean ± SEM of three independent experiments. (D and E) WB analysis of SERPINA1/alpha-1-antitrypsin mutant Z (α1-AT [ATZ]) in protein lysates of S/SHep and A/AHep cells. Cells were transfected with the pcDNA3.1-α1-AT [ATZ] plasmid for 24 h. Transfected cells were treated with DMSO, the proteasome inhibitor MG132 only (20 µM) (C), the lysosomal inhibitor Baf A1 only (100 nM) (D), MG132 plus the translation inhibitor CHX (100 µg/mL) (C), or Baf A1 plus CHX (D) for the indicated durations. The graphs depict the ATZ level normalized to the ACTB level after treatment for 6 h. Data are presented as mean ± SEM of three independent experiments. (F) WB analysis of SQSTM1, an endogenous cargo of autophagy in protein lysates of S/SHep and A/AHep cells. S/SHep and A/AHep cells were treated with DMSO or Tm and then with MG132 (20 µM) only or MG132 plus CHX for the indicated durations before harvesting samples. The graphs depict the SQSTM1 level normalized to the ACTB level after treatment for 6 h. Data are presented as mean ± SEM of three independent experiments. A two-way ANOVA with Sidak’s post hoc test was used in (B)-(F).
![Figure 3. Autophagic flux is impaired in A/A cells during ER stress. (A) Representative TEM images of S/SHep and A/AHep cells treated with DMSO or Tm (1 µg/mL) for 24 h. The panels of the second (red) and third (yellow) rows are magnified images of the red and yellow boxes in the panels of the first row, respectively. Green arrowheads indicate autophagosomes, red arrowheads indicate autolysosomes, and yellow arrows indicate the ER. The dotted yellow line defines a mass of dilated and fragmented ER structures. Scale bars: first row 2 µm and second and third rows 0.5 µm. (B) Quantification of the number of autolysosomes per cell in the TEM images in (A). Data are presented as mean ± SEM of three independent experiments (at least 15 cells per condition). (C) WB analysis of LC3B in protein lysates of S/SHep and A/AHep cells. Cells were treated with DMSO or Tm (1 µg/mL) for 16 h in the absence or presence of the lysosomal inhibitor Baf A1 (200 nM) for 3 h before harvest. The graph depicts the LC3B-II level normalized to the ACTB level. Data are presented as mean ± SEM of three independent experiments. (D and E) WB analysis of SERPINA1/alpha-1-antitrypsin mutant Z (α1-AT [ATZ]) in protein lysates of S/SHep and A/AHep cells. Cells were transfected with the pcDNA3.1-α1-AT [ATZ] plasmid for 24 h. Transfected cells were treated with DMSO, the proteasome inhibitor MG132 only (20 µM) (C), the lysosomal inhibitor Baf A1 only (100 nM) (D), MG132 plus the translation inhibitor CHX (100 µg/mL) (C), or Baf A1 plus CHX (D) for the indicated durations. The graphs depict the ATZ level normalized to the ACTB level after treatment for 6 h. Data are presented as mean ± SEM of three independent experiments. (F) WB analysis of SQSTM1, an endogenous cargo of autophagy in protein lysates of S/SHep and A/AHep cells. S/SHep and A/AHep cells were treated with DMSO or Tm and then with MG132 (20 µM) only or MG132 plus CHX for the indicated durations before harvesting samples. The graphs depict the SQSTM1 level normalized to the ACTB level after treatment for 6 h. Data are presented as mean ± SEM of three independent experiments. A two-way ANOVA with Sidak’s post hoc test was used in (B)-(F).](/cms/asset/8b094dfd-9037-4cf5-ae8b-5f7be79ef86d/kaup_a_2173900_f0003_oc.jpg)
Figure 4. Nuclear translocation of TFEB and TFE3 is impaired in A/A cells during ER stress. (A) Luciferase activity assay of the 5xCLEAR luciferase reporter. S/SMEF and A/AMEF cells were cotransfected with plasmids expressing 5XCLEAR-driven firefly luciferase and CMV-driven Renilla luciferase for 30 h. Cells were treated with Tm (100 ng/mL) for the indicated durations or starved with EBSS for 12 h, and then luciferase activities were measured. Data are presented as mean ± SEM of three independent experiments. (B) Representative IF images of TFEB (upper) and TFE3 (lower) in S/SHep and A/AHep cells treated with Tm (1 µg/mL) for the indicated durations. Scale bar: 20 µm. The percentage of cells with nuclear localized TFEB or TFE3 is indicated in each image and shown in the graphs. Data are presented as mean ± SEM of three independent experiments (about 140–500 cells per condition). (C) WB analysis of the subcellular distributions of TFEB and TFE3 in S/SHep and A/AHep cells treated without or with Tm (1 µg/mL) for 24 h. LMNA (lamin A/C) and ACTB were used as loading controls of the nuclear and cytoplasmic fractions, respectively. (D) Densitometric quantification of nuclear TFEB and TFE3 in (C). Values were normalized against LMNA levels. Data are presented as mean ± SEM of three independent experiments. (E and F) Representative IF images of TFEB (E) and TFE3 (F) in WT HeLa cells (HeLa-WT), HA-Cas9- and FLAG-EIF2S1S51A-expressing HeLa cells (HeLa-Cas9 EIF2S1S51A OE), and HA-Cas9- and FLAG-EIF2S1S51A-expressing and EIF2S1-KO HeLa cells (HeLa-Cas9 EIF2S1S51A OE EIF2S1 KO). Cells were treated with DMSO or Tm (2 µg/mL) for 24 h. Scale bar: 20 µm. The graphs depict the percentage of cells with nuclear TFEB or TFE3. Data are presented as mean ± SEM of three independent experiments (at least 150 cells per condition). (G) WB analysis of the subcellular distributions of TFEB and TFE3 in HeLa-WT, HeLa-Cas9 EIF2S1S51A OE, and HeLa-Cas9 EIF2S1S51A OE EIF2S1 KO cells treated with DMSO or Tm (2 µg/mL) for 24 h. Histone H3 and ACTB were used as loading controls of the nuclear and cytoplasmic fractions, respectively. (H) Densitometric quantification of nuclear TFEB and TFE3 in (G). Values were normalized against Histone H3 levels. Data are presented as mean ± SEM of three independent experiments. A two-way ANOVA with Sidak’s post hoc test was used in (A)-(H).
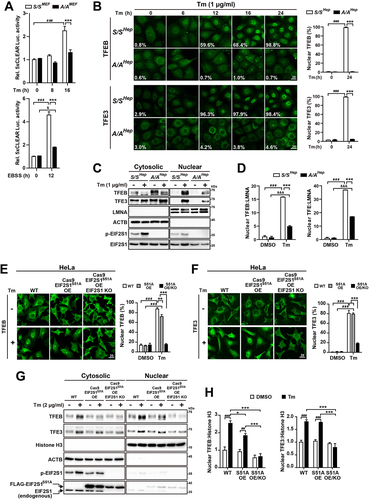
Figure 5. EIF2S1 phosphorylation deficiency does not impede regulation of TFEB and TFE3 nuclear translocation by YWHA. (A) Representative fluorescence images of TFEB-EGFP in S/S-TFEB-EGFP MEFs. S/S-TFEB-EGFP MEFs were treated with DMSO, Tm only (50 ng/mL), or Tm (50 ng/mL) plus the PPP3 inhibitor FK506 (5 µM) for 16 h. The cellular localization of TFEB-EGFP was indicated by the green fluorescence signal of EGFP in cells. Nuclei were stained with DAPI (blue). Scale bar: 20 µm. The graph depicts the percentage of cells with nuclear TFEB-EGFP. Data are presented as mean ± SEM of three independent experiments (at least 130 cells per condition). (B) WB analysis of TFEB-EGFP and endogenous TFEB in protein lysates of cells treated with the same chemicals used in (A). In the left panel, proteins were separated by 6% SDS-PAGE and then subjected to WB analysis with antibodies against GFP or TFEB to detect TFEB-EGFP or endogenous TFEB, respectively. In the right panel, cells were lysed and subjected to IP with an anti-GFP antibody. Immunoprecipitates were analyzed by immunoblotting with antibodies against GFP (to detect TFEB-EGFP), phospho-(Ser)-YWHA binding motif (which binds to phosphorylated TFEB-EGFP at S211), or YWHA. (C and D) Representative measurements of Tm-induced cytosolic Ca2+ changes. WT (Eif2ak3+/+) and eif2ak3-KO (eif2ak3−/−) MEFs (C) and S/SMEF and A/AMEF cells (D) were treated with Tm (10 µg/mL), and Fura-2 Ca2+ imaging was performed as described in the Materials and Methods. The graphs depict the cytosolic Ca2+ concentration in basal and Tm-stimulated MEFs (Eif2ak3+/+, n = 169; eif2ak3−/−, n = 167; S/SMEF, n = 134; and A/AMEF, n = 131). Data are presented as mean ± SEM. (E and F) WB analysis of TFEB and TFE3 in protein lysates of S/SHep and A/AHep cells treated with the MTOR inhibitor Torin 2 (250 nM) (E) or Tm (1 µg/mL) (F) for the indicated durations. Proteins were separated by 6% SDS-PAGE to detect differences in the migration of TFEB and TFE3 proteins. (G) WB analysis of the phosphorylation status of TFEB-EGFP in protein lysates of S/S- and A/A-TFEB-EGFP MEFs treated with Tm (100 ng/mL) for the indicated durations. The phosphorylation status of TFEB-EGFP was analyzed using specific antibodies against phosphorylated S211 and phosphorylated S142 of TFEB. The graphs depict the levels of TFEB-EGFP phosphorylated at S211 or S142 normalized to that of total TFEB-EGFP. Data are presented as mean ± SEM of three independent experiments. *p < 0.05 and **p < 0.01, S/S-TFEB-EGFP vs A/A-TFEB-EGFP; #,&p < 0.05, ##,&&p < 0.01, and ###,&&&, 0 h vs. each time point in S/S- and A/A-TFEB-EGFP MEFs; N.S; not significant. (H and I) WB analysis of immunoprecipitated TFEB-EGFP and YWHA in S/S- and A/A-TFEB-EGFP MEFs treated with Torin 2 (50 nM, 3 h) (H) or Tm (50 ng/mL, 16 h) (I). Torin 2 treatment was performed for 3 h, which did not significantly change the levels of TFEB-EGFP proteins (see Fig. S3F vs Fig. S4C). Cells were lysed and subjected to IP with an anti-GFP antibody. Immunoprecipitates were analyzed by immunoblotting with antibodies against GFP (to detect TFEB-EGFP), phospho-(Ser)-YWHA binding motif (which binds to phosphorylated TFEB-EGFP at S211), phospho-TFEB-(S142), or YWHA. A one-way ANOVA with Tukey’s post hoc test in (A) was used and a two-way ANOVA with Sidak’s post hoc test was used in (C), (D), and (G).
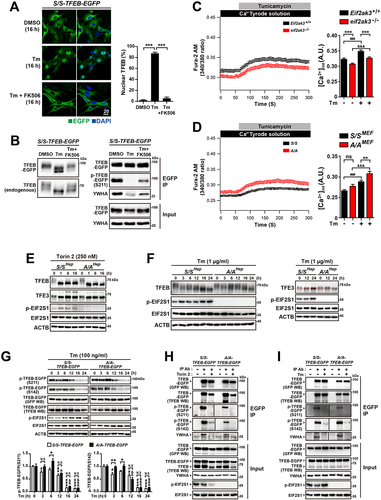
Figure 6. TFEB translocates to the nucleus in A/A cells but is subsequently exported to the cytoplasm under ER stress conditions. (A–D) Representative fluorescence images of TFEB-EGFP in S/S- and A/A-TFEB-EGFP MEFs. MEFs were treated with DMSO (A), Tm (40 ng/mL) only (B), the nuclear export inhibitor LMB (20 nM) only (C), or Tm (40 ng/mL) plus LMB (20 nM) (D) for the indicated durations. The cellular localization of TFEB-EGFP was indicated by the green fluorescence signal of EGFP in cells. Nuclei were stained with DAPI (blue). Scale bar: 20 µm. (E) The percentage of cells with nuclear TFEB-EGFP in (A–D) at 16 h. Data are presented as mean ± SEM of three independent experiments (at least 140 cells per condition). ***p < 0.001, S/S-TFEB-EGFP vs. A/A-TFEB-EGFP; ###p < 0.001, DMSO vs. chemicals in S/S-TFEB-EGFP; &&&p < 0.001, DMSO vs. chemicals in A/A-TFEB-EGFP. (F) Representative fluorescence images of TFEB-EGFP in A/A-TFEB-EGFP MEFs. MEFs were pretreated with Tm (40 ng/mL) for 6 h and further incubated with Tm in the absence or presence of LMB (20 nM) for the indicated durations. The cellular localization of TFEB-EGFP was indicated by the green fluorescence signal of EGFP in cells. Nuclei were stained with DAPI (blue). Scale bar: 20 µm. (G) The percentage of cells with nuclear TFEB-EGFP in (F). Data are presented as mean ± SEM of three independent experiments (at least 130 cells per condition). ***p < 0.001, Tm (6 h) vs. other conditions. A two-way ANOVA with Sidak’s post hoc test was used in (E) and a one-way ANOVA with Dunnett’s post hoc test was used in (G).
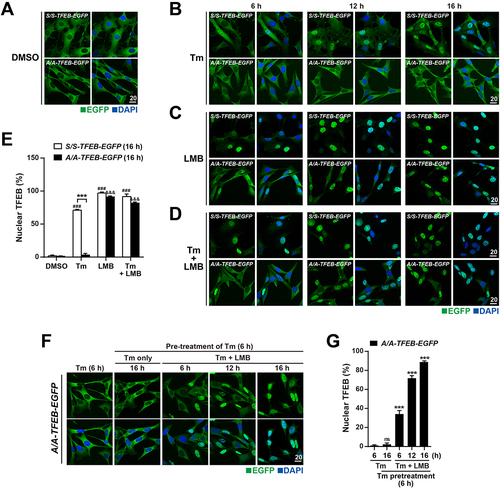
Figure 7. OE of the activated ATF6 form induces nuclear translocation of TFEB in A/A cells. (A) Representative IF images of endogenous TFEB or TFE3 (red) and EGFP (green) or HA (white) in A/AHep cells. Cells were infected with vector-, ATF4/EGFP, FLAG-XBP1s/EGFP- or HA-ATF6[Citation1-373]-expressing adenoviruses for 24 h and then treated with DMSO or Tm (1 µg/mL) for 24 h. Nuclei were stained with DAPI (blue). Scale bar: 20 µm. The numbers indicate the nuclear vs. cytosolic distribution ratios of endogenous TFEB or TFE3 of EGFP-positive cells in Fig. S5D. Data are presented as mean of three independent experiments (at least 150 cells per condition). (B) WB analysis of the subcellular distributions of endogenous TFEB and TFE3 in vector- or HA-ATF6[Citation1-373]-overexpressing A/AHep cells. Cells infected with vector- or HA-ATF6[Citation1-373]-expressing adenoviruses for 24 h were treated with DMSO or Tm (1 µg/mL) for 24 h. Nuclear TFEB and TFE3 levels normalized by Histone H3 levels are shown below the panels. Data are presented as mean ± SEM of three independent experiments. Histone H3 and TUBA/tubulin alpha were used as loading controls of the nuclear and cytoplasmic fractions, respectively. (C and D) WB analysis of immunoprecipitated TFEB-EGFP and YWHA (C) or HA-ATF6[Citation1–373] (D) in vector- or HA-ATF6[Citation1-373]-overexpressing A/A-TFEB-EGFP MEFs treated with DMSO or Tm (100 ng/mL, 24 h). Cells were lysed and subjected to IP with an anti-GFP antibody (C) or anti-HA antibody (D). Immunoprecipitates were analyzed by immunoblotting with antibodies against GFP (to detect TFEB-EGFP), phospho-(Ser)-YWHA binding motif (which binds to phosphorylated TFEB-EGFP at S211), YWHA, ATF6, or HA-ATF6[Citation1–373]. (E and F) Quantified results of the PLA between TFEB-EGFP and HA-ATF6[Citation1–373] in Fig. S6B. A/A-TFEB-EGFP MEFs transfected with plasmids expressing vector or HA-ATF6[Citation1–373] for 30 h were treated with DMSO or Tm (100 ng/mL) for 16 h. (E) The graph depicts the fraction (%) of cells with PLA signals in the nucleus, nucleus and cytosol, or cytosol. Data are presented as mean of three independent experiments (at least 70 cells per condition). ##p < 0.01, and ###p < 0.001, nucleus vs. nucleus and cytosol; &&&p < 0.001, nucleus vs. cytosol; $p < 0.05, nucleus and cytosol vs. cytosol (one-way ANOVA with Tukey’s post hoc test). *p < 0.05, DMSO vs. Tm in cytosolic PLA-positive cells (paired Student’s t-test). (F) The graph depicts quantification of the relative PLA MFI in the nucleus. Data are presented as mean ± SEM of three independent experiments (at least 32 cells per condition). A one-way ANOVA with Tukey’s post hoc test was used. Representative PLA images of A/A-TFEB-EGFP MEFs are presented in Fig. S6B. (G) Quantification of colocalization of TFEB-EGFP with HA-ATF6[Citation1–373] in Fig. S6C. A/AMEF cells were cotransfected with plasmids expressing TFEB-EGFP and vector or TFEB-EGFP and HA-ATF6[Citation1–373]. They were treated with DMSO or Tm (100 ng/mL) for 16 h, fixed, and stained with an anti-HA antibody (red) to detect HA-ATF6[Citation1–373]. Representative colocalization IF images of HA-ATF6[Citation1–373] and TFEB-EGFP in A/AMEF cells are presented in Fig. S6C. Data are presented as mean ± SEM of three independent experiments (at least 25 cells per condition). A two-way ANOVA with Sidak’s post hoc test was used.
![Figure 7. OE of the activated ATF6 form induces nuclear translocation of TFEB in A/A cells. (A) Representative IF images of endogenous TFEB or TFE3 (red) and EGFP (green) or HA (white) in A/AHep cells. Cells were infected with vector-, ATF4/EGFP, FLAG-XBP1s/EGFP- or HA-ATF6[Citation1-373]-expressing adenoviruses for 24 h and then treated with DMSO or Tm (1 µg/mL) for 24 h. Nuclei were stained with DAPI (blue). Scale bar: 20 µm. The numbers indicate the nuclear vs. cytosolic distribution ratios of endogenous TFEB or TFE3 of EGFP-positive cells in Fig. S5D. Data are presented as mean of three independent experiments (at least 150 cells per condition). (B) WB analysis of the subcellular distributions of endogenous TFEB and TFE3 in vector- or HA-ATF6[Citation1-373]-overexpressing A/AHep cells. Cells infected with vector- or HA-ATF6[Citation1-373]-expressing adenoviruses for 24 h were treated with DMSO or Tm (1 µg/mL) for 24 h. Nuclear TFEB and TFE3 levels normalized by Histone H3 levels are shown below the panels. Data are presented as mean ± SEM of three independent experiments. Histone H3 and TUBA/tubulin alpha were used as loading controls of the nuclear and cytoplasmic fractions, respectively. (C and D) WB analysis of immunoprecipitated TFEB-EGFP and YWHA (C) or HA-ATF6[Citation1–373] (D) in vector- or HA-ATF6[Citation1-373]-overexpressing A/A-TFEB-EGFP MEFs treated with DMSO or Tm (100 ng/mL, 24 h). Cells were lysed and subjected to IP with an anti-GFP antibody (C) or anti-HA antibody (D). Immunoprecipitates were analyzed by immunoblotting with antibodies against GFP (to detect TFEB-EGFP), phospho-(Ser)-YWHA binding motif (which binds to phosphorylated TFEB-EGFP at S211), YWHA, ATF6, or HA-ATF6[Citation1–373]. (E and F) Quantified results of the PLA between TFEB-EGFP and HA-ATF6[Citation1–373] in Fig. S6B. A/A-TFEB-EGFP MEFs transfected with plasmids expressing vector or HA-ATF6[Citation1–373] for 30 h were treated with DMSO or Tm (100 ng/mL) for 16 h. (E) The graph depicts the fraction (%) of cells with PLA signals in the nucleus, nucleus and cytosol, or cytosol. Data are presented as mean of three independent experiments (at least 70 cells per condition). ##p < 0.01, and ###p < 0.001, nucleus vs. nucleus and cytosol; &&&p < 0.001, nucleus vs. cytosol; $p < 0.05, nucleus and cytosol vs. cytosol (one-way ANOVA with Tukey’s post hoc test). *p < 0.05, DMSO vs. Tm in cytosolic PLA-positive cells (paired Student’s t-test). (F) The graph depicts quantification of the relative PLA MFI in the nucleus. Data are presented as mean ± SEM of three independent experiments (at least 32 cells per condition). A one-way ANOVA with Tukey’s post hoc test was used. Representative PLA images of A/A-TFEB-EGFP MEFs are presented in Fig. S6B. (G) Quantification of colocalization of TFEB-EGFP with HA-ATF6[Citation1–373] in Fig. S6C. A/AMEF cells were cotransfected with plasmids expressing TFEB-EGFP and vector or TFEB-EGFP and HA-ATF6[Citation1–373]. They were treated with DMSO or Tm (100 ng/mL) for 16 h, fixed, and stained with an anti-HA antibody (red) to detect HA-ATF6[Citation1–373]. Representative colocalization IF images of HA-ATF6[Citation1–373] and TFEB-EGFP in A/AMEF cells are presented in Fig. S6C. Data are presented as mean ± SEM of three independent experiments (at least 25 cells per condition). A two-way ANOVA with Sidak’s post hoc test was used.](/cms/asset/3d9a787b-2775-463b-812a-ede125860df9/kaup_a_2173900_f0007_oc.jpg)
Figure 8. OE of the activated ATF6 form increases expression of autophagy genes and improves autophagic defects in A/A cells during ER stress. A/AHep cells infected with vector- or HA-ATF6[Citation1-373]-expressing adenoviruses for 24 h were treated with DMSO or Tm (1 µg/mL) for the indicated durations. (A) Quantitative RT-PCR analysis of mRNA expression of ER stress response and autophagy genes. Data are presented as mean ± SEM of three independent experiments. *p < 0.05, **p < 0.01, and ***p < 0.001, Ad-vector vs. Ad-HA-ATF6[Citation1–373]; #p < 0.05, ##p < 0.01, and ###p < 0.001, DMSO vs. Tm in Ad-vector; &p < 0.05, &&p < 0.01, and &&& p < 0.001, DMSO vs. Tm in Ad-HA-ATF6[Citation1–373]. The dotted line was put to compare relative mRNA levels of HA-ATF6[Citation1-373]-expressing A/A cells with them of ATF4- (Fig. S8A) or FLAG-XBP1s (Fig. S8B)-overexpressing A/A cells. (B) WB analysis of ER stress and autophagy proteins in cell lysates. To observe the expression levels of ER stress, overexpressed TF, and autophagy proteins, lysates were prepared from HA-ATF6[Citation1-373]-overexpressing A/AHep cells after Tm treatment at each time point. Lysates of Tm (0 and 24 h)-treated S/SHep cells were prepared as positive controls. The lysates were subjected to WB analysis of the indicated proteins. ATF6(N): cleaved N-terminal fragment of endogenous ATF6. The LC3B-II:I ratios are shown below the right first panel. CTSB: cathepsin B; CTSL: cathepsin L; Pro: procathepsin; Sc: mature single-chain cathepsin; Dc: heavy chain of mature double-chain cathepsin. (C) Representative images of LysoTracker staining in vector- or HA-ATF6[Citation1-373]-overexpressing A/AHep cells. Cells were stained with LysoTracker (100 nM, red) and Hoechst 33,258 (10 μg/mL, blue) for the last 30 min of the treatment. The dotted white line defines the cell boundary. Scale bar: 20 µm. The graph depicts quantification of the MFI of LysoTracker. Data are presented as mean ± SEM of three independent experiments (at least 150 cells per condition). (D) Representative IF images of LC3A/B (green) and LAMP1 (red) in vector- or HA-ATF6[Citation1-373]-overexpressing A/AHep cells. Nuclei were stained with DAPI (blue). The bottom panels are magnified images of the boxes in the upper panels. Yellow IF signal indicates double labeling of LC3A/B (green) and LAMP1 (red). Scale bar: 20 µm. (E) The graph depicts the fraction (%) of cells with different LC3A/B staining patterns as described in . Data are presented as mean ± SEM of three independent experiments (at least 150 cells per condition). (F) The graph depicts quantification of the colocalization of LC3A/B with LAMP1 in (D). Data are presented as mean ± SEM of three independent experiments (at least 150 cells per condition). (G) Representative TEM images of vector- or HA-ATF6[Citation1-373]-overexpressing A/AHep cells. The bottom panels are magnified images of the red boxes in the upper panels. Red arrowheads indicate autolysosomes, and yellow arrows indicate the ER. The dotted yellow line defines a mass of dilated and fragmented ER structures. Scale bars: upper panels 1 or 2 µm and bottom panels 0.2 µm. (H) Quantification of the number of autolysosomes per cell TEM images in (G). Data are presented as mean ± SEM of three independent experiments (at least 15 cells per condition). A two-way ANOVA with Sidak’s post hoc test was used in (A), (C), (F), and (H).
![Figure 8. OE of the activated ATF6 form increases expression of autophagy genes and improves autophagic defects in A/A cells during ER stress. A/AHep cells infected with vector- or HA-ATF6[Citation1-373]-expressing adenoviruses for 24 h were treated with DMSO or Tm (1 µg/mL) for the indicated durations. (A) Quantitative RT-PCR analysis of mRNA expression of ER stress response and autophagy genes. Data are presented as mean ± SEM of three independent experiments. *p < 0.05, **p < 0.01, and ***p < 0.001, Ad-vector vs. Ad-HA-ATF6[Citation1–373]; #p < 0.05, ##p < 0.01, and ###p < 0.001, DMSO vs. Tm in Ad-vector; &p < 0.05, &&p < 0.01, and &&& p < 0.001, DMSO vs. Tm in Ad-HA-ATF6[Citation1–373]. The dotted line was put to compare relative mRNA levels of HA-ATF6[Citation1-373]-expressing A/A cells with them of ATF4- (Fig. S8A) or FLAG-XBP1s (Fig. S8B)-overexpressing A/A cells. (B) WB analysis of ER stress and autophagy proteins in cell lysates. To observe the expression levels of ER stress, overexpressed TF, and autophagy proteins, lysates were prepared from HA-ATF6[Citation1-373]-overexpressing A/AHep cells after Tm treatment at each time point. Lysates of Tm (0 and 24 h)-treated S/SHep cells were prepared as positive controls. The lysates were subjected to WB analysis of the indicated proteins. ATF6(N): cleaved N-terminal fragment of endogenous ATF6. The LC3B-II:I ratios are shown below the right first panel. CTSB: cathepsin B; CTSL: cathepsin L; Pro: procathepsin; Sc: mature single-chain cathepsin; Dc: heavy chain of mature double-chain cathepsin. (C) Representative images of LysoTracker staining in vector- or HA-ATF6[Citation1-373]-overexpressing A/AHep cells. Cells were stained with LysoTracker (100 nM, red) and Hoechst 33,258 (10 μg/mL, blue) for the last 30 min of the treatment. The dotted white line defines the cell boundary. Scale bar: 20 µm. The graph depicts quantification of the MFI of LysoTracker. Data are presented as mean ± SEM of three independent experiments (at least 150 cells per condition). (D) Representative IF images of LC3A/B (green) and LAMP1 (red) in vector- or HA-ATF6[Citation1-373]-overexpressing A/AHep cells. Nuclei were stained with DAPI (blue). The bottom panels are magnified images of the boxes in the upper panels. Yellow IF signal indicates double labeling of LC3A/B (green) and LAMP1 (red). Scale bar: 20 µm. (E) The graph depicts the fraction (%) of cells with different LC3A/B staining patterns as described in Figure 2A. Data are presented as mean ± SEM of three independent experiments (at least 150 cells per condition). (F) The graph depicts quantification of the colocalization of LC3A/B with LAMP1 in (D). Data are presented as mean ± SEM of three independent experiments (at least 150 cells per condition). (G) Representative TEM images of vector- or HA-ATF6[Citation1-373]-overexpressing A/AHep cells. The bottom panels are magnified images of the red boxes in the upper panels. Red arrowheads indicate autolysosomes, and yellow arrows indicate the ER. The dotted yellow line defines a mass of dilated and fragmented ER structures. Scale bars: upper panels 1 or 2 µm and bottom panels 0.2 µm. (H) Quantification of the number of autolysosomes per cell TEM images in (G). Data are presented as mean ± SEM of three independent experiments (at least 15 cells per condition). A two-way ANOVA with Sidak’s post hoc test was used in (A), (C), (F), and (H).](/cms/asset/0865a354-8ef0-404b-bc0e-1523097ec754/kaup_a_2173900_f0008_oc.jpg)
Figure 9. OE of the constitutively active TFEB mutant enhances expression of autophagy genes and improves autophagic defects in A/A cells during ER stress. (A) Luciferase activity assay of the 5xCLEAR luciferase reporter. A/AMEF cells were cotransfected with plasmids expressing 5xCLEAR-driven firefly luciferase, CMV-driven Renilla luciferase, and FLAG-tagged TFEB (TFEB[WT]-FLAG or TFEBS211A-FLAG) for 30 h. Cells were then treated with DMSO or Tm (100 ng/mL) for 16 h, and luciferase activities were measured. Data are presented as mean ± SEM of three independent experiments. ***p < 0.001, Vector vs. TFEB[WT]-FLAG or TFEBS211A-FLAG; ###p < 0.001, DMSO vs. Tm; &&&p < 0.001, TFEB[WT]-FLAG vs. TFEBS211A-FLAG. (B) WB analysis of overexpressed TFEB[WT]-FLAG and TFEBS211A-FLAG proteins in A/AMEF cells in (A). (C) Quantitative RT-PCR analysis of mRNA expression of ER stress response and autophagy genes in vector-, TFEB[WT]-FLAG-, or TFEBS211A-FLAG-overexpressing A/AHep cells. A/AHep cells infected with vector-, TFEB[WT]-FLAG-, or TFEBS211A-FLAG-expressing adenoviruses for 24 h were treated with DMSO or Tm (1 µg/mL) for 24 h. Data are presented as mean ± SEM of three independent experiments. *p < 0.05, **p < 0.01, and ***p < 0.001, Ad-vector vs. Ad-TFEB[WT]-Flag or Ad-TFEBS211A-Flag; #p < 0.05 and ##p < 0.01, Ad-TFEB[WT]-Flag vs. Ad-TFEBS211A-Flag. Ctsb: cathepsin B; Ctsd: cathepsin D; Ctsl: cathepsin L. (D and E) WB analysis of EIF2S1, p-EIF2S1, its downstream target proteins (D), and autophagy and lysosomal proteins (E) in vector-, TFEB[WT]-FLAG-, or TFEBS211A-FLAG-overexpressing A/AHep cells. Cells infected with vector-, TFEB[WT]-FLAG-, or TFEBS211A-FLAG-expressing adenoviruses for 24 h were treated with DMSO or Tm (1 µg/mL) for the indicated durations. Cell lysates were prepared at each time point after Tm treatment. Lysates of Tm (0 and 24 h)-treated S/SHep cells were prepared as positive controls. They were subjected to WB analysis of the indicated proteins. The LC3B-II:I ratios are shown below the first panel in (E). CTSB: cathepsin B; CTSL: cathepsin L; Pro: procathepsin; Sc: mature single-chain cathepsin; Dc: heavy chain of mature double-chain cathepsin. (F) Representative IF images of LC3A/B (green) and TFEBS211A-FLAG (red) in vector- or TFEBS211A-FLAG-overexpressing A/AHep cells. Cells were treated with DMSO or Tm (1 µg/mL) for 24 h. The dotted white line defines the cell boundary. Scale bar: 20 µm. The graph depicts the fraction (%) of cells with different LC3A/B staining patterns as described in . Data are presented as mean ± SEM of three independent experiments (at least 150 cells per condition). (G) Representative LysoTracker staining images of vector- or TFEBS211A-FLAG-overexpressing A/AHep cells. Cells were stained with LysoTracker (100 nM, red) and Hoechst 33,258 (10 μg/mL, blue) for the last 30 min of the treatment. The dotted white line defines the cell boundary. Scale bar: 20 µm. The graph depicts quantification of the MFI of LysoTracker. Data are presented as mean ± SEM of three independent experiments (at least 150 cells per condition). (H) Representative IF images of LC3A/B (green) and LAMP1 (red) in vector- or TFEBS211A-FLAG-overexpressing A/AHep cells. Cells were treated with DMSO or Tm (1 µg/mL) for 24 h. Nuclei were stained with DAPI (blue). The third panels in the bottom row are magnified images of the boxes in the second panels. Yellow IF signal indicates double labeling of LC3A/B (green) and LAMP1 (red). Scale bars: 20 µm except for the magnified images (10 µm). The graph depicts quantification of the colocalization of LC3A/B with LAMP1. Data are presented as mean ± SEM of three independent experiments (at least 150 cells per condition). A one-way ANOVA with Tukey’s post hoc test was used in (C) and a two-way ANOVA with Sidak’s post hoc test was used in (A), (G), and (H).
![Figure 9. OE of the constitutively active TFEB mutant enhances expression of autophagy genes and improves autophagic defects in A/A cells during ER stress. (A) Luciferase activity assay of the 5xCLEAR luciferase reporter. A/AMEF cells were cotransfected with plasmids expressing 5xCLEAR-driven firefly luciferase, CMV-driven Renilla luciferase, and FLAG-tagged TFEB (TFEB[WT]-FLAG or TFEBS211A-FLAG) for 30 h. Cells were then treated with DMSO or Tm (100 ng/mL) for 16 h, and luciferase activities were measured. Data are presented as mean ± SEM of three independent experiments. ***p < 0.001, Vector vs. TFEB[WT]-FLAG or TFEBS211A-FLAG; ###p < 0.001, DMSO vs. Tm; &&&p < 0.001, TFEB[WT]-FLAG vs. TFEBS211A-FLAG. (B) WB analysis of overexpressed TFEB[WT]-FLAG and TFEBS211A-FLAG proteins in A/AMEF cells in (A). (C) Quantitative RT-PCR analysis of mRNA expression of ER stress response and autophagy genes in vector-, TFEB[WT]-FLAG-, or TFEBS211A-FLAG-overexpressing A/AHep cells. A/AHep cells infected with vector-, TFEB[WT]-FLAG-, or TFEBS211A-FLAG-expressing adenoviruses for 24 h were treated with DMSO or Tm (1 µg/mL) for 24 h. Data are presented as mean ± SEM of three independent experiments. *p < 0.05, **p < 0.01, and ***p < 0.001, Ad-vector vs. Ad-TFEB[WT]-Flag or Ad-TFEBS211A-Flag; #p < 0.05 and ##p < 0.01, Ad-TFEB[WT]-Flag vs. Ad-TFEBS211A-Flag. Ctsb: cathepsin B; Ctsd: cathepsin D; Ctsl: cathepsin L. (D and E) WB analysis of EIF2S1, p-EIF2S1, its downstream target proteins (D), and autophagy and lysosomal proteins (E) in vector-, TFEB[WT]-FLAG-, or TFEBS211A-FLAG-overexpressing A/AHep cells. Cells infected with vector-, TFEB[WT]-FLAG-, or TFEBS211A-FLAG-expressing adenoviruses for 24 h were treated with DMSO or Tm (1 µg/mL) for the indicated durations. Cell lysates were prepared at each time point after Tm treatment. Lysates of Tm (0 and 24 h)-treated S/SHep cells were prepared as positive controls. They were subjected to WB analysis of the indicated proteins. The LC3B-II:I ratios are shown below the first panel in (E). CTSB: cathepsin B; CTSL: cathepsin L; Pro: procathepsin; Sc: mature single-chain cathepsin; Dc: heavy chain of mature double-chain cathepsin. (F) Representative IF images of LC3A/B (green) and TFEBS211A-FLAG (red) in vector- or TFEBS211A-FLAG-overexpressing A/AHep cells. Cells were treated with DMSO or Tm (1 µg/mL) for 24 h. The dotted white line defines the cell boundary. Scale bar: 20 µm. The graph depicts the fraction (%) of cells with different LC3A/B staining patterns as described in Figure 2A. Data are presented as mean ± SEM of three independent experiments (at least 150 cells per condition). (G) Representative LysoTracker staining images of vector- or TFEBS211A-FLAG-overexpressing A/AHep cells. Cells were stained with LysoTracker (100 nM, red) and Hoechst 33,258 (10 μg/mL, blue) for the last 30 min of the treatment. The dotted white line defines the cell boundary. Scale bar: 20 µm. The graph depicts quantification of the MFI of LysoTracker. Data are presented as mean ± SEM of three independent experiments (at least 150 cells per condition). (H) Representative IF images of LC3A/B (green) and LAMP1 (red) in vector- or TFEBS211A-FLAG-overexpressing A/AHep cells. Cells were treated with DMSO or Tm (1 µg/mL) for 24 h. Nuclei were stained with DAPI (blue). The third panels in the bottom row are magnified images of the boxes in the second panels. Yellow IF signal indicates double labeling of LC3A/B (green) and LAMP1 (red). Scale bars: 20 µm except for the magnified images (10 µm). The graph depicts quantification of the colocalization of LC3A/B with LAMP1. Data are presented as mean ± SEM of three independent experiments (at least 150 cells per condition). A one-way ANOVA with Tukey’s post hoc test was used in (C) and a two-way ANOVA with Sidak’s post hoc test was used in (A), (G), and (H).](/cms/asset/61c35b99-6fdf-4da9-9edd-87ee22041650/kaup_a_2173900_f0009_oc.jpg)
Figure 10. OE of the constitutively active TFEB mutant rescues the autophagic flux defect in A/A cells during ER stress. (A and -C) Representative TEM images of vector- or TFEBS211A-FLAG-overexpressing A/AHep cells. Cells infected with vector- or TFEBS211A-FLAG-expressing adenoviruses for 24 h were treated with DMSO or Tm (1 µg/mL) for 24 h. (B) Quantification of the number of autolysosomes per cell in the TEM images in (A). Data are presented as mean ± SEM of three independent experiments (at least 15 cells per condition). The bottom panels in (A) are magnified images of the red boxes in the upper panels. Red arrowheads indicate autolysosomes and yellow arrows indicate the ER. The dotted yellow line defines a mass of dilated and fragmented ER structures. Scale bars: upper panels of (A) (2 µm) and bottom panels of (A) and (C) (0.5 µm). (D) WB analysis of LC3B in protein lysates of vector- or TFEBS211A-FLAG-overexpressing A/AHep cells. Cells infected with vector- or TFEBS211A-FLAG-expressing adenoviruses for 24 h were treated with DMSO or Tm (1 µg/mL) for 16 h in the absence or presence of the lysosomal inhibitor Baf A1 (200 nM) for 3 h before harvest. The graph depicts the LC3B-II level normalized to the ACTB level. Data are presented as mean ± SEM of three independent experiments, N.S., no significant difference. (E) WB analysis of ATZ in protein lysates of vector- or TFEBS211A-FLAG-overexpressing A/AHep cells. Cells were cotransfected with plasmids expressing ATZ and vector or TFEBS211A-FLAG for 24 h and then treated with DMSO, MG132 only (20 µM), or MG132 plus CHX (100 µg/mL) for 6 h. The graphs depict the ATZ level normalized to the ACTB level after treatment for 6 h. Data are presented as mean ± SEM of three independent experiments. A two-way ANOVA with Sidak’s post hoc test was used in (B), (D), and (E).
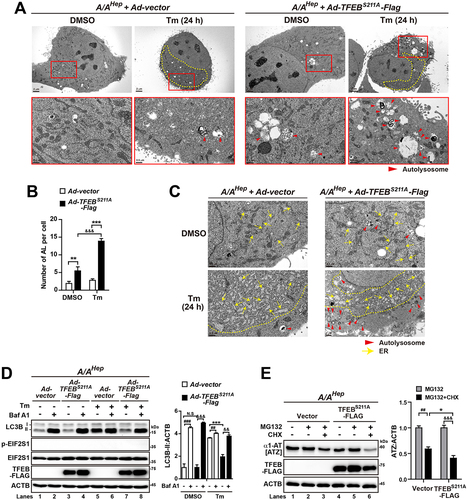
Table 1. List of reagents used in this study.
Table 2. List of antibodies used in this study.
Table 3. List of PCR primers used in this study.
Table 4. List of qPCR primers used in this study.