Figures & data
Figure 1. Accumulation of LDs and impaired lipophagy in hippocampal microglia of db/db mice. (A) Immunostaining of PLIN2+ (LDs) and AIF1+ (microglia), and quantification of PLIN2+ microglia (yellow arrow) in the hippocampi of db/m and db/db mice. Brain tissues were analyzed from five independent experiments (n = 5 mice per group). Scale bar: 50 μm. (B) Representative 3D reconstructions of LDs in astrocyte and in neurons in CA3 region of the hippocampus of db/db mice. Scale bar: 50 μm. (C) Representative 3D reconstructions of BODIPY+ (LDs) and AIF1+ (microglia), and quantification of BODIPY+ microglia in CA3 region of hippocampus. Scale bar: 15 μm. (D) Representative electron microscope images showing autophagosome (arrow), lipophagosome (quadrangle) and LDs (yellow) in the hippocampal microglia (n = 3 mice per group). Scale bar: 1 μm. (E) Representative 3D reconstructions of microglial lipophagy and quantification of LC3B puncta and SQSTM1 puncta in the hippocampal microglia. Lipophagy was visualized using LC3B and SQSTM1, and microglia were visualized using AIF1. Scale bar: 50 μm. ** P < 0.01, *** P < 0.001.
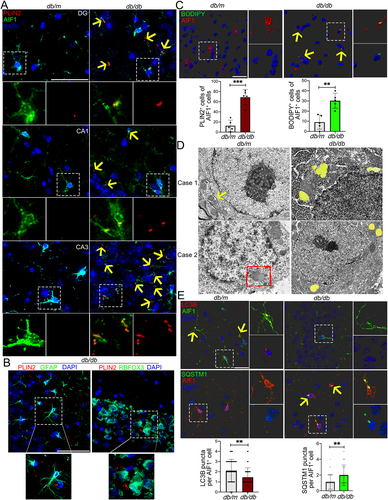
Figure 2. HG-dampened lipophagy was responsible for the accumulation of LDs in microglia. (A and B) Immunostaining and representative Imaris 3D reconstructions of BODIPY+- and PLIN2 +-LDs in BV2 cells treated with plasma of db/m and db/db mice (A) and treated with 5.5 mM and 25 mM glucose for 72 h (B). Scale bar: 25 μm. The percent of cells with BODIPY+ puncta and PLIN2 + puncta were quantified. (C and D) Confocal images and quantifications of LC3B puncta and SQSTM1 puncta in BV2 cells treated with plasma of db/m and db/db mice (C) and treated with 5.5 mM and 25 mM glucose for 72 h (D). Scale bar: 25 μm. (E) Representative electron microscope images of autophagosome (arrow) and LDs (yellow) of BV2 cells. Scale bar: 1 μm. (F and G) Validation of LC3B-I/II, SQSTM1 and PLIN2 expressions in BV cells treated with glucose and Baf (F) or RAPA (G) via western blotting. ACTB was used as control. *P < 0.05, ** P < 0.01, *** P < 0.001.
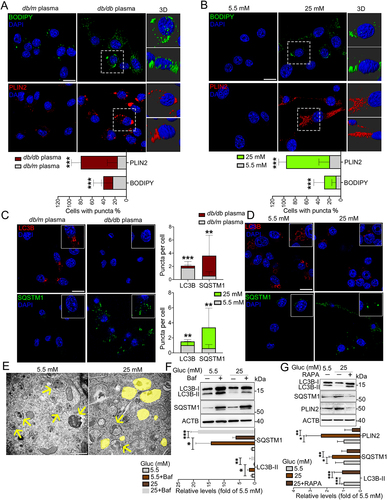
Figure 3. Plasma of aged T2DM patients induced accumulation of LDs and inhibited lipophagy in human HMC3 cells. (A) Level of plasma glycated ALB (albumin) in healthy controls (n = 14) and T2DM patients (n = 15) (The normal reference value of serum glycated ALB is 11–17%). (B) Representative micrographs of HMC3 cells treated with plasma of healthy controls and T2DM patients. Lipophagy was both visualized using LC3B and SQSTM1, and LDs were visualized using PLIN2. Scale bar: 50 μm. (C) the number of LC3B puncta, SQSTM1 puncta and PLIN2+ cells were quantified. (D) the association between the number of PLIN2+ HMC3 cells and DSST score of all participants were analyzed. (E) Confocal images of HMC3 cells treated with glucose for 72 h. Lipophagy was both visualized using LC3B and SQSTM1, and LDs were visualized using PLIN2. The number of LC3B puncta, SQSTM1 puncta and PLIN2 puncta were quantified. Scale bar: 50 μm. (F) Validation of LC3B-I/II, SQSTM1 and PLIN2 expressions in HMC3 cells via western blotting. ACTB was used as control. *P < 0.05, ** P < 0.01, *** P < 0.001.
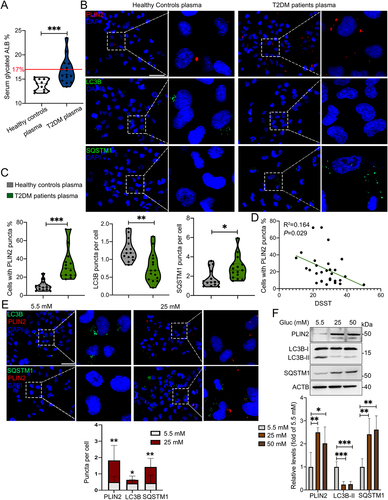
Figure 4. Increased protein level of TREM1 in hyperglycemic plasma or HG-cultured microglia and in the hippocampal microglia of db/db mice. (A) the mRNA expression levels of TREM and TREML receptors were analyzed by RT-Qpcr and TREM1 protein expressions was detected via western blotting (B). ACTB was used as control. (C) Western blotting analysis of TREM1 protein expressions and (D) confocal images of TREM1 in BV2 cells treated with plasma of db/db mice. Scale bar: 50 μm. (E) Confocal images of TREM1 in HMC3 cells treated with T2DM patients plasma. The number of TREM1+ cells were quantified. Scale bar: 50 μm. (F) Representative Imaris 3D reconstructions of TREM1-positive expression in IBA+ microglia of the hippocampi of db/db and HFD/STZ mice. TREM1-positive cells were quantified. Scale bar: 50 μm. *P < 0.05, ** P < 0.01, *** P < 0.001.
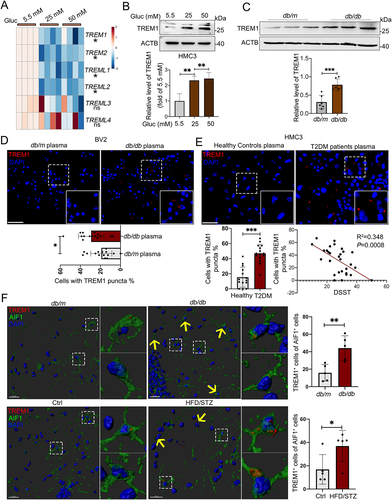
Figure 5. HG induced colocalization of TREM1 with LDs in microglial cells in vivo and in vitro. Representative immunostaining of TREM1 and PLIN2 in HMC3 cells cultured with plasma from T2DM patients (A) and HG (B). The number of TREM1+ cells in PLIN2− and PLIN2+ cells were quantified. Scale bar: 50 μm. (C and D) Representative micrographs of TREM1 and PLIN2 in different morphologies in HMC3 cells cultured with plasma from T2DM patients (C) and BV2 cells cultured with plasma from db/db mice (D). Scale bar: 10 μm. (E) Representative Imaris 3D reconstructions of colocalization of TREM1 and PLIN2 in the hippocampal microglia of db/db mice (upper panel) and HFD/STZ mice (lower panel). The number of TREM1+ cells in PLIN2− and PLIN2+ cells were quantified. (n = 5 mice per group, scale bar: 15 μm). (F) Co-IP validation of TREM1 and PLIN2 interaction in HMC3 cells cultured with HG. (G) Western blotting analysis of the expression of TREM1 and its downstream protein, phospho-SYK in HG and RAPA treated HMC3. ACTB was used as control. *P < 0.05, ** P < 0.01, *** P < 0.001.
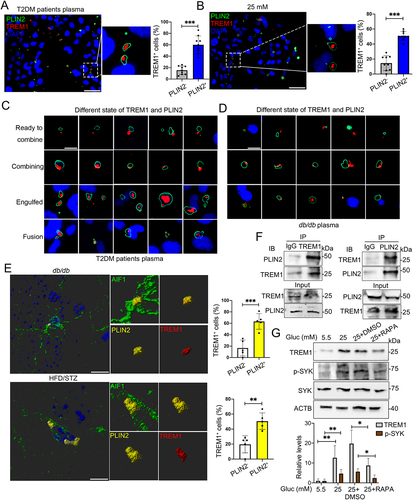
Figure 6. Suppression of TREM1 reversed impairment of lipophagy and accumulation of LDs in HG-stimulated microglia. (A) Schematic diagram for HG-impaired lipophagy, accumulation of LDs and TREM1 in microglia. (B) Western blotting analysis of TREM1, phospho-SYK, LC3B-I/II, SQSTM1 and PLIN2 expressions in Trem1-specific shRNA-infected BV2 cells. *P < 0.05, ** P < 0.01, *** P < 0.001. (C) Representative micrographs of BV2 cells co-treated with glucose and LP17. Lipophagy was visualized using SQSTM1 puncta, and LDs were visualized using PLIN2 puncta. The numbers of SQSTM1 puncta and PLIN2 puncta were quantified. Scale bar: 50 μm. ** P < 0.01: 25 mM vs 25 mM + LP17. (D and E) Western blotting analysis of phospho-SYK, LC3B-I/II, SQSTM1 and PLIN2 expressions in BV2 cells (D) and HMC3 cells (E) co-treated with glucose and LP17. ACTB was used as control. *P < 0.05, ** P < 0.01, *** P < 0.001. (F) Representative micrographs of lipophagy in HMC3 cells co-treated with glucose and LP17 via immunostaining with SQSTM1 and PLIN2. The number of SQSTM1 puncta and PLIN2 puncta were quantified. Scale bar: 50 μm. *P < 0.05, ** P < 0.01: 25 mM vs 25 mM + LP17.
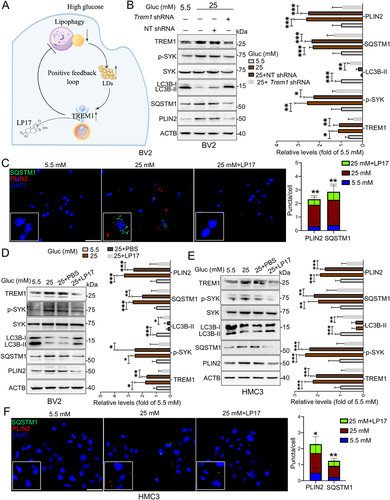
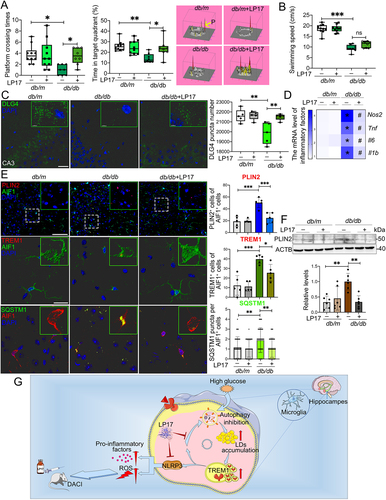
Figure 7. Pharmacological blockade of TREM1 in db/db model improved cognitive function, reduced hippocampal neuronal degeneration and inhibited microglial inflammation. db/m and db/db mice were administrated with or without LP17 injection. (A) Platform crossing times, time spent in the target quadrant (P, Platform) and (B) average swimming speed of the MWM test (n = 10 mice for db/m, n = 8 mice for db/db). (C) Representative Imaris reconstructions of DLG4 in hippocampus and quantification of DLG4 puncta in the hippocampus of mice from different groups. (D) mRNA expression of inflammatory factors in the hippocampus of mice from different groups. *P < 0.05: db/m vs. db/db; #P < 0.05: db/db vs. db/db + LP17. (E) Representative micrographs of PLIN2 (upper panel, scale bar: 50 μm) and representative Imaris 3D reconstructions of colocalization of TREM1 (middle panel, scale bar: 15 μm) or SQSTM1 (lower panel, scale bar: 15 μm) with AIF1 in the hippocampus of mice from different groups. The numbers of PLIN2+AIF1+, TREM1+AIF1+ and SQSTM1 puncta per AIF1+ cells were quantified. *P < 0.05, **P < 0.01, ***P < 0.001. (F) Western blotting analysis of PLIN2 expressions in the hippocampus of db/m and db/db mice with or without LP17. **P < 0.01. (G) Proposed series of events involved in HG-impaired microglia and the blockade of TREM1 pathway with LP17 administration as a new strategy for DACI therapy.