
Figures & data
Figure 1. Determining redundancies of canonical mitophagy receptors for mitophagy in AML. (A) Schematic illustration of multiplex mitophagy receptor CRISPR/Cas9 Screen in MV4–11 cells. (B) Schematic illustration of the mitophagy reporter mt-mKEIMA. (C) MAGeCK-derived log2-fold changes (LFCs) for inherent single screens of OA- and DFP-induced mitophagy. Significantly changed genes (p < 0.05) are marked with dark-filled circles. (D) Quantification of mitophagy induction shown in Figure S1D in MV4–11 cells upon shRNA-mediated knockdown of BNIP3 or FKBP8. Mitophagy was induced by treatment with 0.5 mM DFP for 16 h and quantified by mt-mKEIMA pH 4:pH 7 ratio. Data are normalized to DFP-treated CTRL cells (n = 3). (E) Proliferation analysis of expansion curves of MV4–11 cells upon shRNA-mediated knockdown of BNIP3 or FKBP8. Proliferation was determined by cell numbers after seven days of proliferation and normalized to control (CTRL) cells. (F) Heatmap of top 20 depleted combinations for multiplex screens of OA- and DFP-induced mitophagy. Significantly depleted combinations (p < 0.05) are marked in bold. (G) Schematic illustration of genetic interaction (GI) analysis for mitophagy using the additive model. (H) Number of GIs for DFP- or OA-induced mitophagy. (I) Heatmap of additive model-derived Delta log2-fold-change (ΔLFC) for all gene pairs from the multiplex mitophagy receptor screen. ΔLFC is calculated from the observed and expected LFC for each gene pair and plotted for OA treatment vs DFP treatment. (J) Functional interactome of synergistic mitophagy GIs calculated in (I). Node color describes receptor type (classic, mitochondrial membrane (MM) receptor or other). Edges describe the type of interaction (DFP only, OA only or common).
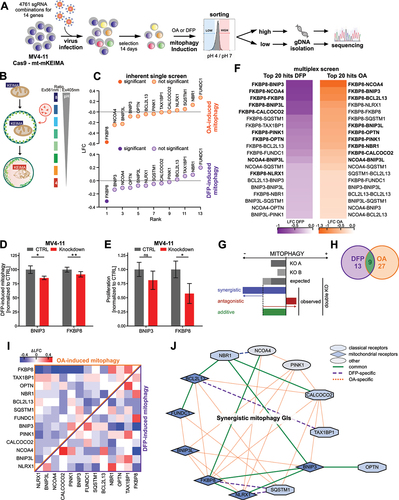
Figure 2. Loss of OPTN impairs mitophagy flux in AML cells. (A) Representative flow cytometry plots of mt-mKEIMA in MV4–11 and THP1 cells after knockdown of OPTN and treatment with 0.5 mM deferiprone (DFP) for 16 h. (B) Quantification of mitophagy induction from (A) and Figure S2E. Data are normalized to untreated control cells (n = 3). (C) Representative flow cytometry plots of mt-mKEIMA in MV4–11 and THP1 cells after knockdown of OPTN and treatment with 10 µM oligomycin/antimycin a (OA) for 4 h. (D) Quantification of mitophagy induction from (C) and Figure 2E. Data are normalized to untreated control cells (n = 3). (E) Schematic illustration of colocalization experiments for early- and late-stage mitophagy using immunofluorescent staining of TIMM23 or COX4/COXIV in combination with LC3 or LAMP1. (F) Representative immunofluorescent staining of early-stage mitophagy (see E) of CTRL and OPTN-KD human MV4–11 cells after 16 h of 0.5 mM DFP treatment for mitochondrial and autophagosomal markers TIMM23 and LC3, respectively. Arrows indicate colocalization of both markers. DAPI (4‘,6-diamidino-2-phenylindole) was used as a nuclear stain. Scale bar: 10 µm. Original magnification × 63. (G) Pearson’s coefficient for colocalization of TIMM23 and LC3 was analyzed using ImageJ for MV4–11 and THP1 cells (n = 3 with > 50 cells per replicate). Pearson’s coefficient was calculated between TIMM23 staining (channel A) and LC3 staining (channel B) in single cells upon automatic thresholding using moments algorithm [Citation23]. (H) Immunofluorescent staining of late-stage mitophagy (see E) of CTRL and OPTN-KD human THP1 cells after 16 h of 0.5 mM DFP treatment was performed with mitochondrial and lysosomal markers COX4 and LAMP1, respectively. Arrows indicate colocalization of both markers. DAPI (4‘,6-diamidino-2-phenylindole) was used as a nuclear stain. Scale bar: 10 µm. Original magnification × 63. (I) Pearson’s coefficient for colocalization of COX4 and LAMP1 was analyzed using ImageJ for THP1 cells (n = 3 with > 50 cells per replicate). Values are means ± SEM. Student‘s t-test was performed in (B, D, G, I). Note: *p < 0.05, **p < 0.01, ***p < 0.001.
![Figure 2. Loss of OPTN impairs mitophagy flux in AML cells. (A) Representative flow cytometry plots of mt-mKEIMA in MV4–11 and THP1 cells after knockdown of OPTN and treatment with 0.5 mM deferiprone (DFP) for 16 h. (B) Quantification of mitophagy induction from (A) and Figure S2E. Data are normalized to untreated control cells (n = 3). (C) Representative flow cytometry plots of mt-mKEIMA in MV4–11 and THP1 cells after knockdown of OPTN and treatment with 10 µM oligomycin/antimycin a (OA) for 4 h. (D) Quantification of mitophagy induction from (C) and Figure 2E. Data are normalized to untreated control cells (n = 3). (E) Schematic illustration of colocalization experiments for early- and late-stage mitophagy using immunofluorescent staining of TIMM23 or COX4/COXIV in combination with LC3 or LAMP1. (F) Representative immunofluorescent staining of early-stage mitophagy (see E) of CTRL and OPTN-KD human MV4–11 cells after 16 h of 0.5 mM DFP treatment for mitochondrial and autophagosomal markers TIMM23 and LC3, respectively. Arrows indicate colocalization of both markers. DAPI (4‘,6-diamidino-2-phenylindole) was used as a nuclear stain. Scale bar: 10 µm. Original magnification × 63. (G) Pearson’s coefficient for colocalization of TIMM23 and LC3 was analyzed using ImageJ for MV4–11 and THP1 cells (n = 3 with > 50 cells per replicate). Pearson’s coefficient was calculated between TIMM23 staining (channel A) and LC3 staining (channel B) in single cells upon automatic thresholding using moments algorithm [Citation23]. (H) Immunofluorescent staining of late-stage mitophagy (see E) of CTRL and OPTN-KD human THP1 cells after 16 h of 0.5 mM DFP treatment was performed with mitochondrial and lysosomal markers COX4 and LAMP1, respectively. Arrows indicate colocalization of both markers. DAPI (4‘,6-diamidino-2-phenylindole) was used as a nuclear stain. Scale bar: 10 µm. Original magnification × 63. (I) Pearson’s coefficient for colocalization of COX4 and LAMP1 was analyzed using ImageJ for THP1 cells (n = 3 with > 50 cells per replicate). Values are means ± SEM. Student‘s t-test was performed in (B, D, G, I). Note: *p < 0.05, **p < 0.01, ***p < 0.001.](/cms/asset/b920067f-058d-46d1-8418-40cbee424592/kaup_a_2230839_f0002_oc.jpg)
Figure 3. OPTN expression modulates proliferation of AML cells. (A) Quantification of cell proliferation of OPTN knockdown (KD) or overexpression (OE) cells normalized to corresponding control (CTRL) cells (n = 3). (B) Colony numbers were determined in colony-forming assays of OPTN-KD or OPTN-OE cells normalized to the corresponding CTRL cells (n = 3). (C) Quantification of cell proliferation of NTC + CTRL, OPTN-KO + CTRL, OPTN-KO + OPTN-WT, OPTN-KO + OPTNDF474, 475NA and OPTN-KO + OPTNF178A-transduced MV4–11 cells. Statistical significance was calculated to NTC-CTRL (n = 3). (D) BrdU/7AAD staining of CTRL and OPTN-KD murine MN1 or human MV4–11 cells analyzed by flow cytometry. The graph shows percentages of cells in each cell cycle phase (SubG1, < 2N DNA content; G0/G1, BrdU− 2N DNA content; S: BrdU+; G2/M, BrdU− 4N DNA content; n = 3). (E) Quantification of flow cytometry-based ANXA5-7AAD staining of OPTN-KD cells normalized to CTRL cells (n = 3). (F) Quantification of flow cytometry-based ANAX5-7AAD staining in NTC + CTRL, OPTN-KO + CTRL and OPTN-KO + OPTN-WT MV4–11 cells (n = 3). Values are means ± SEM. Student’s t-test was performed in (A-F). Note: *p < 0.05, **p < 0.01, ***p < 0.001.
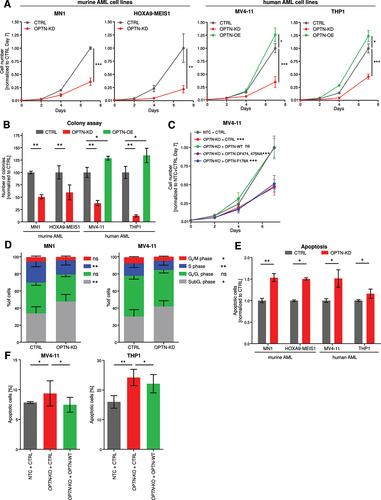
Figure 4. Loss of OPTN delays leukemia progression in murine AML model. (A) Schematic overview of the transplantation procedure. (B) Kaplan-Meier curve represents survival of WT (n = 7) and optn-KO (n = 11) MN1 leukemic mice after transplantation. (C) Colony numbers were determined in serial colony-forming unit assays of WT and OPTN-KO MN1-driven IdMBM leukemia cells isolated from the bone marrow of sick mice at time of death. Experiment was performed in triplicates with 500 LK cells (n = 3). (D) Representative flow cytometry plot of MitoSOX staining in WT and optn-KO MN1-driven IdMBM leukemia cells isolated from the bone marrow of sick mice at time of death. (E) Quantification of MitoSOX staining in (D) (n = 3). Gehan-Breslow-Wilcoxon Test was performed in (B). Student’s t-test was performed in (C, E). Values are means ± SEM. Note: *p < 0.05, **p < 0.01, ***p < 0.001.
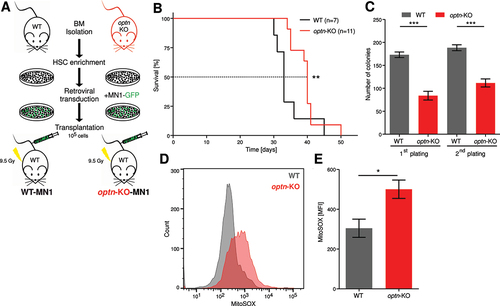
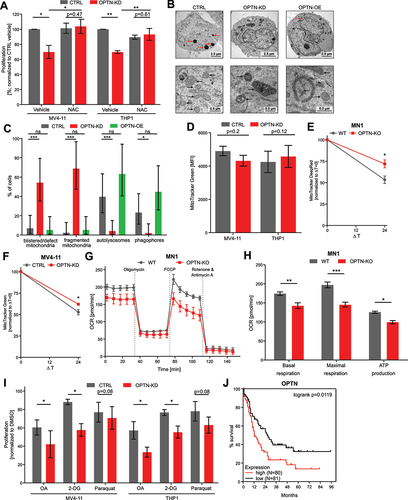
Figure 5. Loss of OPTN impairs mitochondrial function in AML cells. (A) Proliferation of MV4–11 and THP1 cells treated with 200 µM N-acetyl-L-cysteine (NAC) for 24 h after OPTN-KD. Cells were counted using erythrosine B exclusion and cell numbers were normalized to CTRL + vehicle (n = 3). (B) Representative transmission electron microscopy (TEM) images from 50-nm thin sections of plastic embedded MV4–11 CTRL, OPTN-KD, and OPTN-OE cells. Scale bar: 2.5 µM or 0.5 µm. Black arrows indicate mitochondrial structures and red arrows indicate vacuoles, most likely representing autolysosomes. (C) Quantification of cellular structures observed in TEM images shown is (B). Data are percent of analyzed cells with the described structures (CTRL = 43 cells, OPTN-KD = 48 cells, OPTN-OE = 38 cells). P value by exact Poisson statistic, error bars indicate exact 95% confidence intervals assuming Poisson distribution. Experiment was repeated with highly similar results. (D) Quantification of mean fluorescence intensity (MFI) of MitoTracker Green staining in CTRL or OPTN-KD MV4–11 and THP1 cells shown in Figure S5E (THP1: n = 3, MV4–11: n = 4). (E) Quantification of pulse-labeled mitochondria in OPTN-deficient MN1 and (F) MV4–11 cells chased for 24 h after MitoTracker Green or Deep Red staining, respectively. Data are normalized to mean fluorescent intensity after pulse labeling. ΔT = chase time after pulse labeling of mitochondria in hours (n = 3) (G) Representative mitochondrial respiration of WT and optn-KO murine MN1-driven bone marrow cells from leukemic mice was determined by measuring oxygen consumption rate (OCR). (H) Quantification of basal and maximal respiration and ATP production in WT and optn-KO MN1 cells from (G) (n = 3). (I) Cell growth analysis of human MV4–11 and THP1 cells after knockdown of OPTN in presence or absence of 1 mM 2-deoxyglucose (2-DG), 1 µM oligomycin and antimycin a (OA), or 1 mM paraquat. Cells were incubated for 24 h with inhibitors and counted using erythrosine B exclusion. Cell numbers were normalized to DMSO controls (n = 3). (J) TCGA LAML data for adult patients with de novo AML were analyzed for survival and stratified by low (below median; red) and high (above median; black) OPTN mRNA expression. Student’s t-test was performed in (A, C-F, H and I). Values are means ± SEM. Note: *p < 0.05, **p < 0.01, ***p < 0.001.
Supplemental Material
Download MS Word (2.6 MB)Data availability statement
Read counts and MAGeCK outputs for CRISPR-Cas9 screen are provided as Supplementary Tables. Additionally, sequencing data are accessible from GEO (https://www.ncbi.nlm.nih.gov/geo/query/acc.cgi?acc= GSE211073; GSE211073; GSE211073, token: kbozwwekvbknfqd). For detailed information regarding CRISPR screen, lentiviral transduction, constructs, mouse experiments, and immunoblotting, see supplemental Materials and Methods.