Figures & data
Figure 1. Differential autophagy along the dorsal trunk of the larval trachea. (A) the DT is a tubular structure divided into 10 metameres (Tr1-Tr10). Tr2 to Tr8 metameres are shown here, dissected from a larva of the L3 stage. Cell nuclei are labeled with DAPI. Cells of Tr2 are the diploid adult progenitors, while the cells of the rest of the metameres are large polyploid larval cells. Other minor branches that form the larval tracheal system are connected to the dorsal trunk. Scale bar: 100 μm. (B) Magnification of metameres Tr2-Tr9 from L3 larvae carrying the mCh-Atg8a reporter, in magenta; cell nuclei are labeled with DAPI, in white. Scale bars: 20 μm. (B´) Box plots show the distribution of the values of mCh-Atg8a puncta per area in each metamere, which show significant differences between cells of Tr2 and those of the rest of the metameres. For the analysis of variance between groups, Welch’s ANOVA (p = 0.0001) was applied followed by Dunnett’s T3 multiple group comparison test. (alpha set at 0.05. *p < 0.05, **p < 0.01, ***p < 0.0005). n = 9 individuals per group. Error bars represent SD of means. (C) Relative expression levels for the mRNAs of Atg8a in Tr2 and Tr6 metameres, the transcripts of the gene found enriched in Tr6 cells. (***p < 0.0001, Unpaired t-test). n = 6 control btlGal4/+ individuals. (D) Magnification of metameres Tr2-Tr9 of L3 larvae. ref(2)P in green and cell nuclei are labeled with DAPI, in white. Scale bars: 20 μm. (D´) Box plots show the distribution of the values of ref(2)P dots per area and their average size in each metamere of the DT (Tr2-Tr9). The number of ref(2)P dots is higher in Tr2 in comparison to polyploid metameres, and their size decrease progressively along the DT. For the analysis of variance between groups, in both cases, Welch’s ANOVA (p = 0.0001) was applied followed by Dunnett’s T3 multiple group comparison test. (alpha set at 0.05. **p < 0.005, ***p < 0.0005, ****p < 0.0001). Only statistically significant differences are shown. n = 6 per group. btlGal4/+ individuals were used. Error bars represent SD of means. (E) Relative expression levels for the mRNAs of ref(2)P in Tr2 and Tr6 metameres; the transcripts of the gene do not show detectable differences of expression between metameres. (p = 0.33, Unpaired t-test). n = 9 control btlGal4/+ individuals.
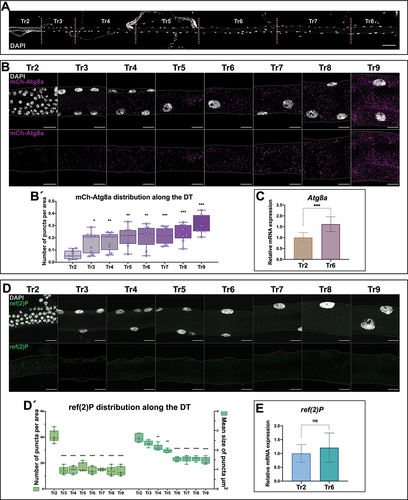
Figure 2. Correlation between autophagy and polyploidy. (A) Mean value of mCh-Atg8a puncta along polyploid metameres (Tr3-Tr9) and mean value for the number of endocycles in the cells of the same metameres. n = 3–7 cells per metamere, 9 individuals. Error bars represent SD of means. (A´) Correlation chart of mCh-Atg8a puncta and C value of polyploid cells along the DT. A positive linear correlation is revealed with high mCh-Atg8a levels associated with elevated polyploidy (Pearson’s r = 0.91, **p = 0.0037). (B) Ectopic expression of yki results in an increase of endocycles and mCh-Atg8a puncta per area. Magnification of metamere Tr6 of L3 larvae in mCh-Atg8a;btlGal4 (control) and mCh-Atg8a;btlGal4>UAS-yki. mCh-Atg8a in magenta and cell nuclei are labeled with DAPI, in white. Thermal scale represents pixel intensities in sum projections for the DAPI channel. Scale bars: 20 μm. (B´) Box plots for the summary of C values (left chart) and mean values of mCh-Atg8a puncta/area (right chart) in Tr3-Tr9 of control and mCh-Atg8a;btlGal4>UAS-yki (alpha set at 0.05. ****p < 0.0001, Unpaired t-test, Welch’s correction) n = 6 individuals per group. Error bars represent SD of means. (C) Switch from diploidy to polyploidy results in increase of autophagy levels as monitored by ref(2)P antibody. Magnification of Tr2 metameres from L3 larvae of btlGal4 (control) and btlGal4>UAS-fzr; ref(2)P in green and cell nuclei are labeled with DAPI, in white. In the second panels, ref(2)P is shown in a single white channel. Thermal scale pseudo color represents pixel intensities in sum projections for the DAPI channel. Scale bars: 20 μm. (C´) Box plots for the number per area (left chart) and the average size (right chart) of ref(2)P puncta in btlGal4 (control) and btlGal4>UAS-fzr (alpha set at 0.05. ****p < 0.0001, two tailed Unpaired t-test, Welch’s correction) n = 5 individuals per group. Error bars represent SD of means.
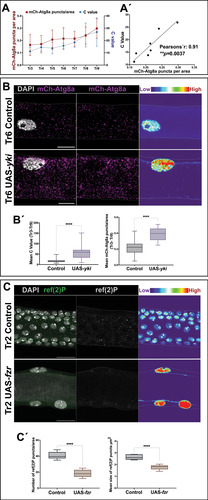
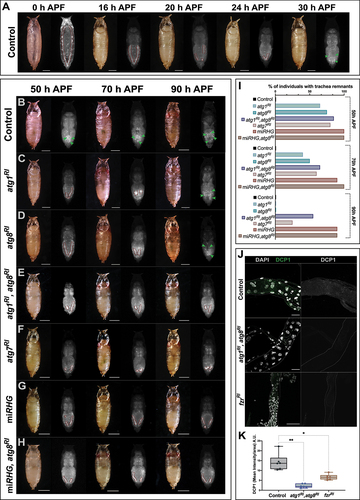
Figure 3. Degradation of the larval DT during metamorphosis is mediated by autophagy eliciting apoptosis. (A) Representative images of control pupae (btlGal4>UAS-DsRed) 0-30 h APF. Larval DT remnants in the abdomen are outlined by a red dashed line. At 30 h APF there are no visible tubular structures and scattered cells, belonging to the newly formed branches of the adult respiratory system can be detected (green arrowheads). (B-H) Representative images of pupae at extreme timepoints showing the delay or defective elimination of DT. Indicative phenotypes of pupae from (B) btlGal4>UAS-DsRed (control), (C) btlGal4>UAS-DsRed,UAS-atg1RI, (D) btlGal4>UAS-DsRed,UAS-atg8RI, (E) btlGal4>UAS-DsRed,UAS-atg1RI,UAS-atg8RI, (F) btlGal4>UAS-DsRed,UAS-atg7RI, (G) btlGal4>UAS-DsRed,UAS-miRHG and (H) btlGal4>UAS-DsRed,UAS-miRHG,UAS-atg8RI. Larval DT remnants noted in the abdomen are outlined by a red dashed line, and scattered cells from branches of the newly formed adult trachea are indicated by green arrowheads. 50 h APF, 70 h APF and 90 h APF are shown. Scale bars: 500 µm. (I) Percentage of individuals found with DT remnants at 50, 70 and 90 h APF. btlGal4>UAS-DsRed (control) n = 25, btlGal4>UAS-DsRed,UAS-atg1RI n = 24, btlGal4>UAS-DsRed,UAS-atg8RI n = 27, btlGal4>UAS-DsRed,UAS-atg1RI,UAS-atg8RI n = 22, btlGal4>UAS-DsRed,UAS-atg7RI n = 25, btlGal4>UAS-DsRed,UAS-miRHG n = 36, btlGal4>UAS-DsRed,UAS-miRHG,UAS-atg8RI n = 35. (J) Tr6 metamere dissected from pupae at 12 h APF, from btlGal4 (control), btlGal4>UAS-atg1RI,UAS-atg8RI and btlGal4>UAS-fzrRI. Apoptosis, marked by DCP1 staining was significantly reduced when autophagy was impaired by combined inhibition of Atg1 and Atg8 and when polyploidy was switched into diploidy by fzrRI. in left panels, DCP1 is labeled in green and nuclear DNA by DAPI in white. In right panels, DCP1 is shown is single channel in white. Scale bars: 50 µm. (K) Box plots show the mean intensity of DCP1 per area in btlGal4 (control), btlGal4>UAS-atg1RI,UAS-atg8RI and btlGal4>UAS-fzrRI. for the analysis of variance between groups, Welch’s ANOVA (p = 0.0001) was applied followed by Dunnett’s T3 multiple group comparison test. (alpha set at 0.05. *p < 0.01, **p < 0.001) n = 6 individuals per group. Error bars represent SD of means.