
Figures & data
Figure 1. The layered structure of the AutophagyNet database. The database includes the core and regulatory proteins, transcription factors and RNAs of the process, and the diverse sets of interactions between them. Abbreviations indicate BCR: B cell receptor pathway; TCR: T cell receptor pathway; RTK: receptor tyrosine kinase pathway; NHR: nuclear hormone receptor pathway; TLR: toll like receptor pathway.
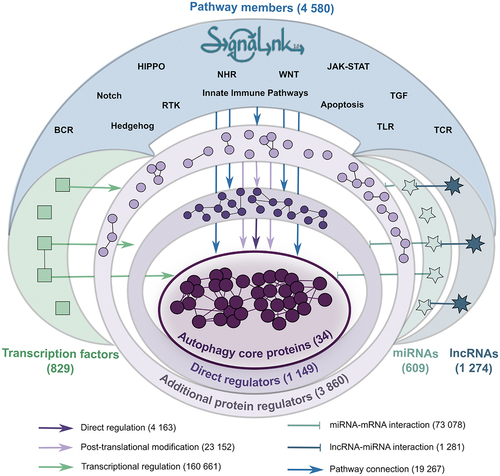
Figure 2. Statistics of AutophagyNet. (A) number of interactions are counted by layer in the previous autophagy regulatory network (gray) and the new AutophagyNet (blue) resources. (B) number of annotated PTM interactions per type of PTM.
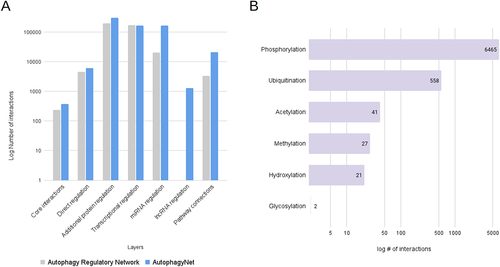
Figure 3. Protein page of AutophagyNet. (A) annotation box with identifiers, autophagy phase, type and tissue annotations. (B) Interactive network box with core (blue) and transcriptional (purple) layers visualized. (C) downloadable details box for selected protein, annotated by source database and publications referencing the interaction.
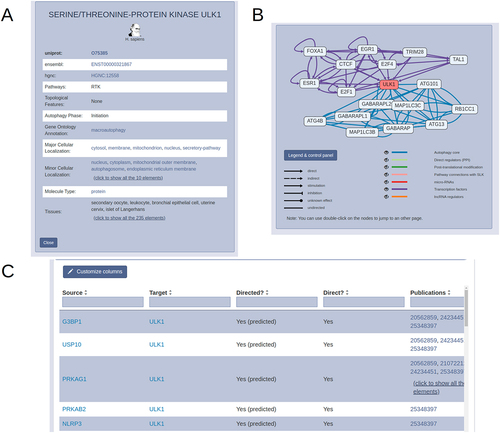
Figure 4. Customizable download options of AutophagyNet. Users can select regulation type, annotations and file formats to personalize the retrieved dataset on the website.
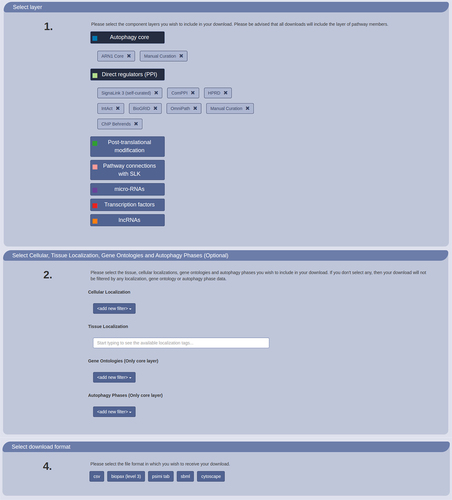
Figure 5. Connection of xenophagy core proteins to signaling pathways. Each circle node represents a core protein involved in xenophagy. Red boxes indicate the phase of autophagy core proteins are involved in. Rectangular nodes represent signaling pathways. The size of each pathway corresponds to the involved protein ratio, while edge width represents the number of regulatory connections from pathway members to the connected core protein.
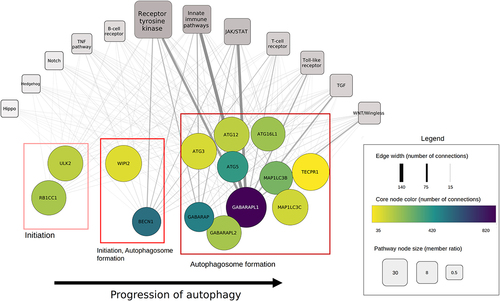
Figure 6. microRNA regulators of BECN1 targeted by bacterial pathogens. Bacterial infections that have been associated with microRnas are presented. Vibrio angillarium infection was described in teleost fish (indicated by dashed lines), not humans. However, this could indicate the possible role of MIR216A in human bacterial infections as discussed later in the discussion section.
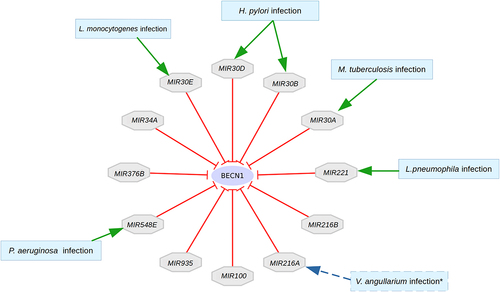
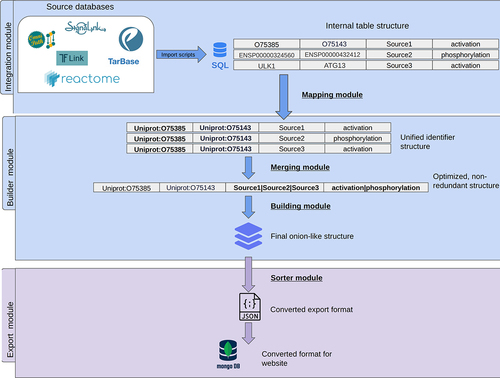
Figure 7. Workflow of building the AutophagyNet dataset. The pipeline is made up of two major modules: the integration and builder module. These are responsible for integrating and organizing the imported resources’ data. The export module converts the unified internal structure to file formats compatible with the user-friendly website.
Supplemental Material
Download MS Word (15 KB)Data availability statement
All data can be freely downloaded from http://autophagynet.org. The workflow for building the database can be accessed on GitHub: https://github.com/korcsmarosgroup/AutophagyNetDB