Figures & data
Figure 1. Exacerbated inflammatory responses in ΔKeratg16l1 skin. (A) Schematic representation of the experimental set-up for inducing topical skin inflammation. (B) Representative dermatoscope images of back skin of control (Atg16l1fl/fl) and ΔKeratg16l1 mice on day 5 of TPA treatment. (C) H&E-stained sections of untreated or TPA-treated skin of Atg16l1fl/fl and ΔKeratg16l1 mice. Scale bars: 100 μm. (D) Epidermal barrier function analysis by time-course measurements of transepidermal water loss (TEWL) (*p = 0.0104; ****p < 0.0001; two-way ANOVA with multiple comparisons; n ≥ 5 mice per condition). (E) Epidermal thickness measured on H&E-stained skin sections from untreated or TPA-treated Atg16l1fl/fl and ΔKeratg16l1 mice (n ≥ 5 mice per condition, for each biological replicate the mean of 10 measurements was taken; ****p < 0.0001; two-way ANOVA with multiple comparisons). (F) Levels of IL6 in serum of TPA-treated Atg16l1fl/fl (n = 10) and ΔKeratg16l1 (n = 12) mice at day 5 of the protocol (**p = 0.0011; Mann-Whitney testing). (G) Flow cytometric analysis of the absolute amount of F4/80hi CD11bhi immune cells per cm2 skin in control Atg16l1fl/fl and ΔKeratg16l1 mice (n ≥ 3 mice per condition; ** p = 0.0016; ***p < 0.0001; two-way ANOVA with multiple comparisons). (H) Epidermal thickness measured on H&E-stained skin sections from untreated or imiquimod (IMQ)-treated Atg16l1fl/fl and ΔKeratg16l1 mice. Data represent means ± SEM (n ≥ 5 mice per condition, for each biological replicate the mean of 10 measurements was taken; **p = 0.01; ***p = 0.0007; two-way ANOVA with multiple comparisons). (I) Time-course TEWL measurements of untreated and IMQ-treated mice (****p < 0.0001; two-way ANOVA with multiple comparisons; n ≥ 5 mice per condition). Data are box whisker plots showing all values. (J) Western blot of PMK lysates obtained from Atg16l1fl/fl and ΔKeratg16l1 skin and treated with TPA or vehicle (veh) for the indicated time-points followed by immunoblotting for ATG16L1, MAP1LC3/LC3 and ACTIN as a loading control.
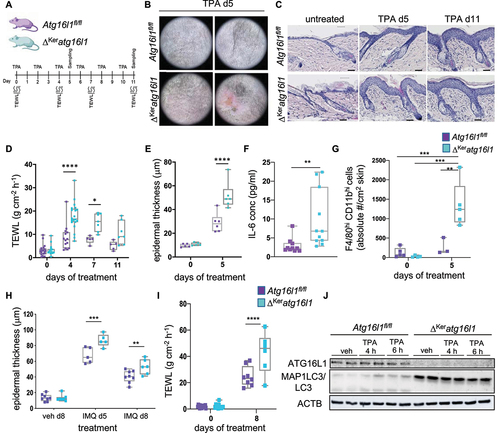
Figure 2. Keratinocyte autophagy protects skin from chemically-induced tumorigenesis. (A) Incidence of papilloma formation in Atg16l1fl/fl(n= 22) and ΔKeratg16l1 (n= 25) mice treated with DMBA and TPA (Wilcoxon matched-pairs signed rank test; ****p< 0.0001). (B) Amount of papillomas per mouse in Atg16l1fl/fl (n= 22) and ΔKeratg16l1 (n= 25) mice treated with DMBA and TPA (Wilcoxon matched-pairs signed rank test; ****p< 0.0001). Data represent means ± SEM. (C) Representative images of back skin of DMBA/TPA-treated Atg16l1fl/fland ΔKeratg16l1 mice at 14, 22 and 27 weeks after first TPA treatment. (D) Immunoblotting of SQSTM1/p62 in skin and tumor lysates of Atg16l1fl/fland ΔKeratg16l1 mice. Anti-ACTIN blot is shown as loading control.
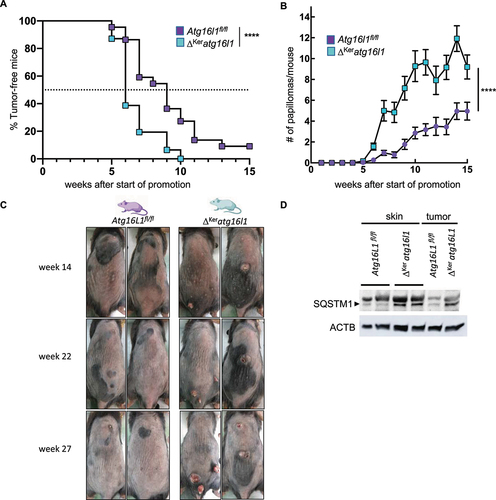
Figure 3. Altered HFSC activation kinetics in ΔKeratg16l1 mice. (A) annotated UMAP clustering of scRNAseq data of live skin cells isolated from 10-weeks-old Atg16l1fl/fl and ΔKeratg16l1 mice (DP: dermal papilla, DS: dermal sheet, SF: stromal fraction, vSM: vascular smooth muscle, TC: T-cells, DC: dendritic cell, MC: macrophage, Susp. Doublet: suspected doublet cells, LH: Langerhans cell, IFE: interfollicular epidermis, ANA: anagen, SG: sebaceous gland, HF: hair follicle, OL: outer layer, OB: outer bulge, EC: endothelial cell, LC: lymphatic cell, MEL: melanocyte, SC: Schwann cell). (B) Distribution of Atg16l1fl/fl and ΔKeratg16l1 cells within the clusters. Dashed line delineates a keratinocyte population that is uniquely present in ΔKeratg16l1 skin. (C) Annotated UMAP plot of keratinocyte subcluster from 10-weeks-old Atg16l1fl/fl and ΔKeratg16l1 mice. (D) UMAP plot showing distribution of Atg16l1fl/fl and ΔKeratg16l1 keratinocytes within this cluster. (E) UMAP plot indicating cell cycle stage of keratinocytes from both genotypes. (F) Bar plots showing relative percentage of Atg16l1-proficient or -deficient keratinocytes in different cell stages. (G) Representative photographs of the back skin of male and female Atg16l1fl/fl and ΔKeratg16l1 littermates at week 10, 11 and 12 of age shaved at 7 weeks of age. (H) Ratio of the surface of anagen back skin to total shaved area in female and male Atg16l1fl/fl and ΔKeratg16l1 mice (n > 10 per genotype; **p < 0.01; ***p = 0.0002; ****p < 0.0001; two-way ANOVA testing with multiple comparisons). (I) H&E-stained sections of 10-weeks old male Atg16l1fl/fl and ΔKeratg16l1 back skin. Scale bars: 200 μm. (J) Relative percentages of proliferating (Ki67+) SC populations in Atg16l1fl/fl and ΔKeratg16l1 mice. (K) Flow cytometric analysis of HFSCs as percentage of live cells in 8-weeks-old Atg16l1fl/fl and ΔKeratg16l1 mice (n = 5 mice per condition; *p = 0.0137; Mann-Whitney testing).
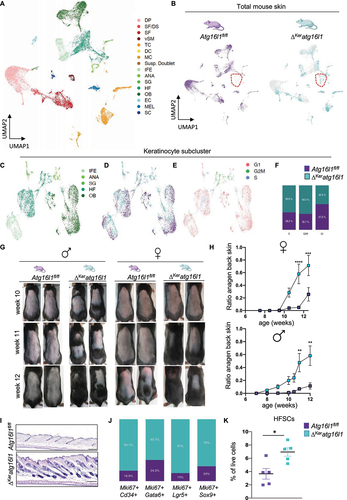
Figure 4. Keratinocyte autophagy dampens Gas6 expression levels in the telogen DP. (A) Annotated UMAP clustering of scRNAseq data of fibroblasts isolated from 10-weeks-old Atg16l1fl/fl and ΔKeratg16l1 mice (DP: dermal papilla, DS: dermal sheet, SF: stromal fraction). (B) Distribution of Atg16l1fl/fl and ΔKeratg16l1 fibroblasts within the clusters with indication of a unique DP population present in ΔKeratg16l1 skin (dashed red line; dashed yellow line indicates the DP population in control skin). (C) Violin plots indicating the expression levels of the known HF growth factors Gas6 and Scube3 produced in different subsets of fibroblasts as determined by scRNAseq. (D) Ridgeline plot showing expression levels of Pappa2 and Crabp1 in fibroblasts of Atg16l1fl/fl and ΔKeratg16l1 mice. (E) Schematic representation of NicheNet analysis identifying ligands secreted by DP fibroblasts that bind on receptors expressed by keratinocytes, mediating gene expression changes. (F) Violin plots showing expression levels of the known GAS6-AXL target genes Aldh1a3, Ccnb1 and Cdk1 in different subsets of Atg16l1fl/fl and ΔKeratg16l1 keratinocytes as determined by scRNAseq.
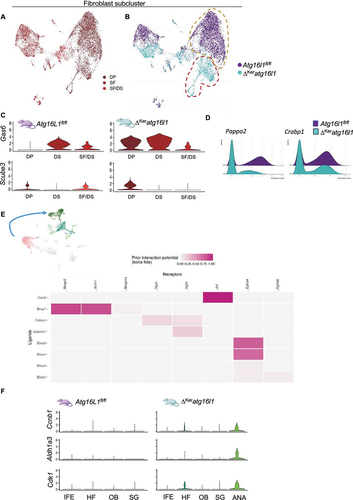
Figure 5. Altered regenerative responses in different subsets of keratinocyte SCs in ΔKeratg16l1 mice. (A) Representative images of wound sites on the back skin of Atg16l1fl/fl and ΔKeratg16l1 littermates at day 15 post-wounding. (B) Wound healing dynamics of Atg16l1fl/fl (n = 8) and ΔKeratg16l1 (n = 9) mice after full-thickness skin wounding with an 8 mm punch biopsy (ns; two-way ANOVA with multiple comparisons). (C) Epidermal barrier function analysis by time-course measurements of transepidermal water loss (TEWL) on full-thickness wounds. (ns; two-way ANOVA with multiple comparisons; n ≥ 5 mice per condition). (D) H&E- (upper panels) and Herovici-stained (lower panels) skin sections of wounds of ΔKeratg16l1 and control skin at day 15 post-wounding, showing de novo HF formation in ΔKeratg16l1 remodeled skin. Scale bars: 200 μm. (E) Immunofluorescent staining for KRT14 , SOX9 and LEF1 on d15pw wounds of Atg16L1fl/fl and ΔKeratg16l1 mice. Scale bars: 100 μm. (F) Epidermal barrier function analysis by time-course TEWL measurements on intermediate wounds in female and male Atg16l1fl/fl and ΔKeratg16l1 mice (***p < 0.001; two-way ANOVA with multiple comparisons; n ≥ 5 mice per condition).
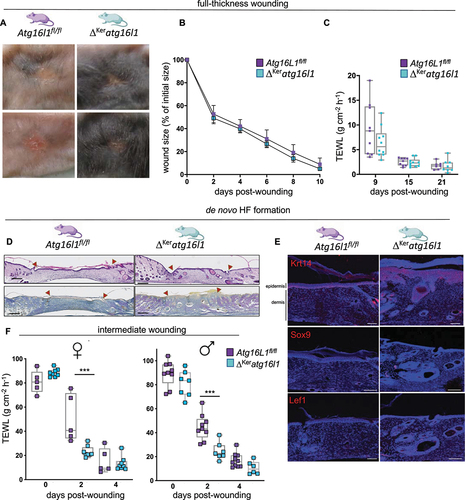
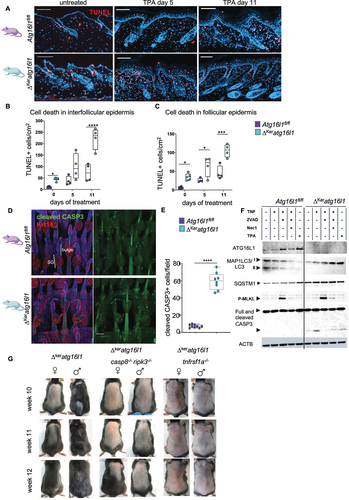
Figure 6. Enhanced sensitivity of ATG16L1-deficient keratinocytes to cell death underlies altered HFSC activation. (A) TUNEL-stained skin sections of Atg16l1fl/fl and ΔKeratg16l1 untreated and TPA-treated mice. Scale bars: 200 μm. (B) Quantification of the number of TUNEL-positive interfollicular epidermis (IFE) cells in untreated and TPA-treated Atg16l1fl/fl and ΔKeratg16l1 mice (n > 4 per genotype; * p = 0,0152; **** p < 0.0001; two-way ANOVA with multiple comparisons). (C) Quantification of the number of TUNEL-positive follicular epidermal cells in untreated and TPA-treated Atg16l1fl/fl and ΔKeratg16l1 mice (n > 4 per genotype; *p < 0.05; ***p = 0.0002; two-way ANOVA with multiple comparisons). (D) Immunofluorescent staining for cleaved CASP3 (green) and KERATIN-14 (Krt14; red) of tail wholemounts of catagen HFs (P44) from Atg16l1fl/fl and ΔKeratg16l1 mice. Right panels show cleaved CASP3 staining only. SG: sebaceous gland. Scale bars: 100 μm. (E) Quantification of cleaved CASP3 positive cells in catagen samples of Atg16l1fl/fl and ΔKeratg16l1 tail epidermis (n = 9 mice per condition; p < 0.0001; Mann-Whitney test). (F) immunoblotting for ATG16L1, MAP1LC3/LC3, SQSTM1/p62, phosphorylated MLKL (p-MLKL), full-length and cleaved CASP3 on lysates from PMKs isolated from Atg16l1fl/fl and ΔKeratg16L1 mice. Cells were untreated or treated with TNF, zVAD-fmk, Nec1S or TPA. ACTIN blot is shown as loading control. (G) Representative photographs of the back skin of ΔKeratg16l1, ΔKeratg16l1 casp8-/- ripk3−/− and ΔKeratg16l1 tnfrsf1a-/- mice at the indicated ages.