
Figures & data
Figure 1. Different levels of autophagy regulation and its’ effect on neuronal development and function.
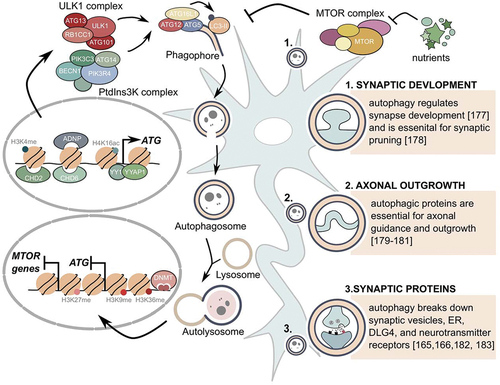
Figure 2. Overview of how the different epigenetic modifiers regulate autophagy and the associated NDDs.
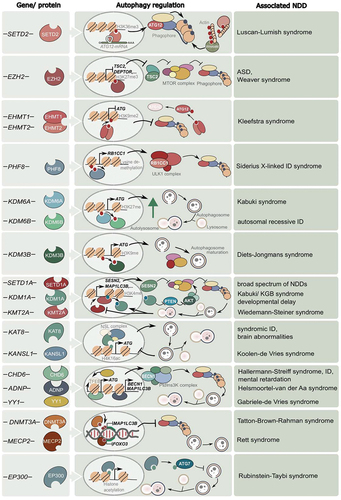
Table 1. Chromatinopathy causing genes associated with altered autophagy regulation and the respective clinical phenotypes.