
Figures & data
Figure 1. Simplified schematic of the role of ATG4 in autophagy in mammals. (A) Priming of an Atg8-family protein via cleavage after the C-terminal glycine by ATG4. (B) Conjugation of Atg8-family proteins to the developing phagophore membrane. (C) Autophagosome formation. (D) Delipidation of Atg8-family proteins from the outer autophagosome membrane by ATG4. Note: exact timing of this process has yet to be determined in mammals, but it is thought to occur prior to and/or shortly after autophagosome-lysosome fusion. (E) Autophagosome-lysosome fusion. (F) Autolysosome formation and degradation of cargo.
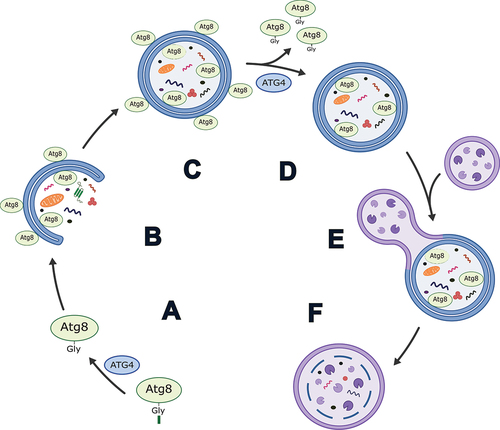
Figure 2. Linear representation of human ATG4D. The 474 amino acid long protein consists of a conserved C54 peptidase domain flanked by N- and C-termini that are divergent from the other three ATG4 homologs. The N terminus contains a CASP3 recognition site (DEVD) that can be cleaved to produce ΔN63 ATG4D. Immediately upstream of this cleavage site is a putative PEST sequence, which suggests ATG4D is a short-lived protein subject to degradation by the proteasome. Immediately downstream is a cryptic mitochondrial motif that is exposed upon CASP3 cleavage. The C terminus contains a putative BH3 domain and LIR motif [Citation21,Citation22,Citation25]. Red arrows indicate known mutations in human ATG4D that are associated with neurodegeneration [Citation29] and blue arrows indicate mutations potentially associated with non-obstructive azoospermia [Citation17].
![Figure 2. Linear representation of human ATG4D. The 474 amino acid long protein consists of a conserved C54 peptidase domain flanked by N- and C-termini that are divergent from the other three ATG4 homologs. The N terminus contains a CASP3 recognition site (DEVD) that can be cleaved to produce ΔN63 ATG4D. Immediately upstream of this cleavage site is a putative PEST sequence, which suggests ATG4D is a short-lived protein subject to degradation by the proteasome. Immediately downstream is a cryptic mitochondrial motif that is exposed upon CASP3 cleavage. The C terminus contains a putative BH3 domain and LIR motif [Citation21,Citation22,Citation25]. Red arrows indicate known mutations in human ATG4D that are associated with neurodegeneration [Citation29] and blue arrows indicate mutations potentially associated with non-obstructive azoospermia [Citation17].](/cms/asset/8d18750b-7d2e-4f7b-b42a-2125760d8353/kaup_a_2369436_f0002_oc.jpg)
Table 1. Summary of neurodegenerative phenotypes associated with knockdown, knockout, or loss-of-function mutations of various ATG4D orthologs.
Figure 3. Conservation of residues Ser89, Arg125, Val273, Tyr280, Ala295 Asp356, and Val395 across various vertebrate species. Red arrows indicate site of amino acid change, and green arrow indicates the beginning of a deletion site and frameshift in variant human ATG4D proteins associated with a neurodevelopmental disorder [Citation29]. Blue arrows indicate site of amino acid changes and blue square brackets indicate deleted region in variant human ATG4D proteins associated with non-obstructive azoospermia, as reported by the authors [Citation17]. Asterisks “*” indicate identical amino acids, colons “:” indicate conserved amino acids, and periods “.” indicate semi conserved amino acids. Alignments performed using ClustalW [Citation74]. NCBI accession numbers: Human (Homo sapiens), NP_116274.3; Chimp (Pan troglodytes), XP_016790485.1; Mouse (Mus musculus), NP_705811.8; Dog (Canis lupus familiaris), XP_038284569.1; Cow (Bos taurus), NP_001092616.1; Common bottlenose dolphin (Tursiops truncates), XP_033710226.1; Zebrafish (Danio rerio), XP_009292712.1; Nile tilapia (Oreochromis niloticus), XP_003447971.1; Xenopus (Xenopus tropicalis), NP_001039246.1; Green sea turtle (Chelonia mydas), XP_037743907.1; American alligator (Alligator mississippiensis), XP_006265658.2.
![Figure 3. Conservation of residues Ser89, Arg125, Val273, Tyr280, Ala295 Asp356, and Val395 across various vertebrate species. Red arrows indicate site of amino acid change, and green arrow indicates the beginning of a deletion site and frameshift in variant human ATG4D proteins associated with a neurodevelopmental disorder [Citation29]. Blue arrows indicate site of amino acid changes and blue square brackets indicate deleted region in variant human ATG4D proteins associated with non-obstructive azoospermia, as reported by the authors [Citation17]. Asterisks “*” indicate identical amino acids, colons “:” indicate conserved amino acids, and periods “.” indicate semi conserved amino acids. Alignments performed using ClustalW [Citation74]. NCBI accession numbers: Human (Homo sapiens), NP_116274.3; Chimp (Pan troglodytes), XP_016790485.1; Mouse (Mus musculus), NP_705811.8; Dog (Canis lupus familiaris), XP_038284569.1; Cow (Bos taurus), NP_001092616.1; Common bottlenose dolphin (Tursiops truncates), XP_033710226.1; Zebrafish (Danio rerio), XP_009292712.1; Nile tilapia (Oreochromis niloticus), XP_003447971.1; Xenopus (Xenopus tropicalis), NP_001039246.1; Green sea turtle (Chelonia mydas), XP_037743907.1; American alligator (Alligator mississippiensis), XP_006265658.2.](/cms/asset/48028796-00f1-40d9-85a5-4907fdf6f41b/kaup_a_2369436_f0003_oc.jpg)
Table 2. Altered expression of ATG4D and its associated protein in various cancer and tumor types.
Figure 4. Pan-cancer analysis of ATG4D expression in normal (left, non-bold) and tumor (right, bold) tissues as determined by RNA-Seq. Tissue types marked in red demonstrate significant differences in ATG4D expression (Mann-Whitney U test, *p < 0.01). Analysis and figure generated using TNMplot [Citation94]. AC: adenocarcinoma; AML: acute myeloid leukemia; CC: clear cell carcinoma; CH: chromophobe; CS: carcinosarcoma; EC: corpus endometrial carcinoma; Esoph: esophagus; PA: papillary cell carcinoma; SC: squamous cell carcinoma.
![Figure 4. Pan-cancer analysis of ATG4D expression in normal (left, non-bold) and tumor (right, bold) tissues as determined by RNA-Seq. Tissue types marked in red demonstrate significant differences in ATG4D expression (Mann-Whitney U test, *p < 0.01). Analysis and figure generated using TNMplot [Citation94]. AC: adenocarcinoma; AML: acute myeloid leukemia; CC: clear cell carcinoma; CH: chromophobe; CS: carcinosarcoma; EC: corpus endometrial carcinoma; Esoph: esophagus; PA: papillary cell carcinoma; SC: squamous cell carcinoma.](/cms/asset/75591692-5183-4880-bedf-f89f128e23d0/kaup_a_2369436_f0004_oc.jpg)
Data availability statement
The data used to generate are available in TNMplot at http://tnmplot.com [Citation94].