
Figures & data
Figure 1. Drosophila Deaf1 regulates muscle regeneration. (A) Flowchart of the genetic screen. Crosses were set up between tub-Gal80ts; zfh1-Gal4, UAS-G-Trace [Citation28] and different UAS-RNAi flies. Progenies were reared at 18°C to avoid unintended RNAi expression during fly development. Adult flies were shifted to 29°C for 7 days to allow zfh1-Gal4 expression that drives the expression of RNAi, RFP, and FLP recombinase specifically in MuSCs. MuSCs expressing FLP recombinase then excise the FRT-flanked stop cassette located between the Ubi-p63E promoter and EGFP. EGFP expression is heritably maintained in all daughter cells. Thus, RFP labels MuSCs expressing zfh1-Gal4 while GFP marks cells that are descendants of MuSCs. (B–C) Overexpression of Deaf1 or Deaf1-RNAi leads to muscle regeneration defects. Representative images of Drosophila muscles at day 7 after G-trace was induced. In injured flies, muscles were stabbed with needles. Subsequently, muscles with or without injuries were stained by phalloidin (cyan) and DAPI (blue). MuSCs labeled by RFP (implying real-time zfh1 expression) and differentiated cells labeled by GFP+ RFP− (implying lineal origin from a zfh1-positive cell) were quantified in (C). Deaf1-RNAi #1 and #2 represent the independent shRNA lines with different targeting sequences. Both targeted Deaf1 and induced same phenotypes, suggesting that the phenotypes we observed were not due to off-target effects. For Deaf1 transgene #1 and #2, they are different constructs with or without tags. Both induced the same phenotypes, suggesting that the effects are not due to construct or plasmid insertion site issues. Scale bar: 10 µm.
![Figure 1. Drosophila Deaf1 regulates muscle regeneration. (A) Flowchart of the genetic screen. Crosses were set up between tub-Gal80ts; zfh1-Gal4, UAS-G-Trace [Citation28] and different UAS-RNAi flies. Progenies were reared at 18°C to avoid unintended RNAi expression during fly development. Adult flies were shifted to 29°C for 7 days to allow zfh1-Gal4 expression that drives the expression of RNAi, RFP, and FLP recombinase specifically in MuSCs. MuSCs expressing FLP recombinase then excise the FRT-flanked stop cassette located between the Ubi-p63E promoter and EGFP. EGFP expression is heritably maintained in all daughter cells. Thus, RFP labels MuSCs expressing zfh1-Gal4 while GFP marks cells that are descendants of MuSCs. (B–C) Overexpression of Deaf1 or Deaf1-RNAi leads to muscle regeneration defects. Representative images of Drosophila muscles at day 7 after G-trace was induced. In injured flies, muscles were stabbed with needles. Subsequently, muscles with or without injuries were stained by phalloidin (cyan) and DAPI (blue). MuSCs labeled by RFP (implying real-time zfh1 expression) and differentiated cells labeled by GFP+ RFP− (implying lineal origin from a zfh1-positive cell) were quantified in (C). Deaf1-RNAi #1 and #2 represent the independent shRNA lines with different targeting sequences. Both targeted Deaf1 and induced same phenotypes, suggesting that the phenotypes we observed were not due to off-target effects. For Deaf1 transgene #1 and #2, they are different constructs with or without tags. Both induced the same phenotypes, suggesting that the effects are not due to construct or plasmid insertion site issues. Scale bar: 10 µm.](/cms/asset/3f1303e5-3a6b-4f34-8d28-658a9c2069f4/kaup_a_2374693_f0001_oc.jpg)
Figure 2. Deaf1-regulated autophagy controls MuSC maintenance and differentiation in Drosophila. (A-B) Drosophila Deaf1 negatively regulates autophagy. Drosophila adult muscles from tubGal80ts; zfh1-Gal4, UAS-mCherry-Atg8a controls or flies expressing Deaf1 or Deaf1-RNAi fed with or without 10 mM Chloroquine for three days were stained with phalloidin (cyan) and DAPI (blue). Atg8a punctate were quantified in (B). Compared to control, Deaf1-RNAi increased Atg8a punctate numbers while Deaf1 overexpression suppressed Atg8a-labeled autophagosome formation. Scale bar: 10 µm. (C–D) Deaf1 overexpression increases protein aggregates. Adult muscles from tubGal80ts; zfh1-Gal4, UAS-CD8-GFP controls or flies expressing Deaf1 were stained with ProteoStat® aggresome dye (red) which detects protein aggregates, phalloidin (cyan), and DAPI (blue) (C). ProteoStat® signals were quantified in (D). Scale bar: 10 µm. (E–F) Modulation of autophagic activity restores Deaf1 overexpression- or Deaf1-RNAi-induced muscle regeneration defects. Adult muscles from flies expressing indicated transgenes were stained with phalloidin (cyan) and DAPI (blue) (E). Scale bar: 10 µm. MuSCs labeled by RFP and differentiated cells labeled by GFP+ RFP− were quantified in (F). (G-H) Changes of Deaf1 expression levels trigger MuSC deaths. Adult muscles from flies as in (A) were stained with anti-cleaved CASP3 (green), phalloidin (cyan), and DAPI (blue) (G). Apoptotic cells labeled by cleaved-CASP3 were quantified in (H). Scale bar: 10 µm.
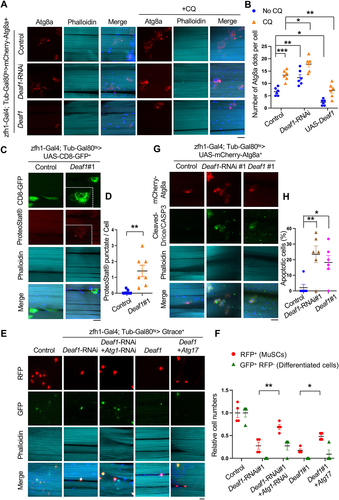
Figure 3. Deaf1 overexpression suppresses autophagy and inhibits MuSC proliferation and differentiation in mammals. (A–B) DEAF1 inhibits autophagosome formation in C2C12 myoblasts. C2C12 cells stably infected with lentivirus expressing Deaf1 were cultured in DMEM with or without Bafilomycin A1 (BafA1) treatment for 4 h and then subjected to immunofluorescence with anti-LC3B (red) and DAPI (blue) (A). LC3 puncta were quantified in (B). Scale bar: 20 µm. (C–G) Deaf1 overexpression induces protein aggregate formation and blocks myoblast differentiation. C2C12 myoblasts stably infected with lentivirus expressing Deaf1 were cultured in DMEM with 10% FBS or with 2% horse serum (for induction of muscle differentiation) and subjected to immunofluorescence with ProteoStat® aggresome dye (C, red) to monitor protein aggregates or anti-MHC antibody (E, red) to indicate differentiated cells. Nuclei were stained with DAPI (blue). Protein aggregates and differentiated cells were quantified in (D) and (F) respectively. Fusion index which is calculated as the percentage of nuclei incorporated in the myotubes relative to the total number of nuclei was shown in (G). Scale bar: 20 µm (C) and 50 µm (E). (H) Deaf1 expression represses cell growth. Cell counts on day1–3 after seeding. (I-J) DEAF1 decreases autophagy flux in isolated MuSCs from mouse muscles. Purified MuSCs infected with lentivirus expressing Deaf1 were treated with or without Baf-A1 for 4 h and subjected to immunofluorescence with anti-LC3B (red) and DAPI (blue) (I). LC3 puncta were quantified in (J). Scale bar: 10 µm. (K–O) DEAF1 represses MuSC differentiation as well as increases protein aggregates. Purified MuSCs infected with lentivirus expressing Deaf1 were cultured with or without 2% horse serum to induce muscle differentiation and were subjected to immunofluorescence with anti-MHC antibody (K, red) or ProteoStat® aggresome dye (N, red). Nuclei were stained with DAPI (blue). Myocytes, fusion index, and protein aggregates were quantified in (L), (M) and (O) separately. Scale bar: 10 µm.
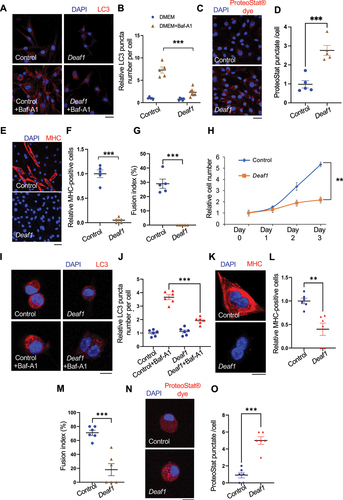
Figure 4. Deaf1 depletion induces autophagy and represses proliferation and differentiation of C2C12 myoblasts and primary MuSCs. (A–B) Deaf1 deficient myoblasts exhibit increased autophagy. GFP− or Deaf1-knockout clones of C2C12 cells were cultured in DMEM with or without Bafilomycin A1 (BafA1) for 4 h and then subjected to immunofluorescence with anti-LC3B antibody (green) and DAPI (blue) (A). LC3 puncta were quantified in (B). Scale bar: 20 µm. (C) Deaf1 depletion suppresses cell growth. Cell counts on day1–3 after seeding. (D–F) Deaf1-knockout C2C12 myoblasts exhibit reduced protein aggregates and defects in differentiation due to autophagy overactivation. Deaf1-KO C2C12 infected with or without lentivirus expressing shAtg7 cultured in DMEM with 10% FBS or with 2% horse serum (for induction of muscle differentiation) and subjected to immunofluorescence with ProteoStat® aggresome dye (D, red) to monitor protein aggregates or anti-MHC antibody (E, red) to indicate differentiated cells. Protein aggregates, differentiated cells, and fusion index, were quantified in (F). Nuclei were stained with DAPI (blue). Scale bar: 50 µm. (G–H) Deaf1 knockdown increases autophagy flux in MuSCs. Purified MuSCs from mouse muscles infected with lentivirus expressing shLuc (control), shDeaf1, or shDeaf1 together with shAtg7, were treated with or without Baf-A1 for 4 h and subjected to immunofluorescence with anti-LC3B antibody (red) and DAPI (blue) (G). LC3 puncta were quantified in (H). Scale bar: 10 µm. (I–K) Deaf1 knockdown decreases protein aggregates and blocks MuSC differentiation. Purified MuSCs infected with lentivirus expressing shDeaf1 were cultured with or without 2% horse serum, subjected to immunofluorescence with ProteoStat® aggresome dye (I, red) or anti-MHC antibody (J, red), and quantified in (K). Nuclei were stained with DAPI (blue). Scale bar: 10 µm.
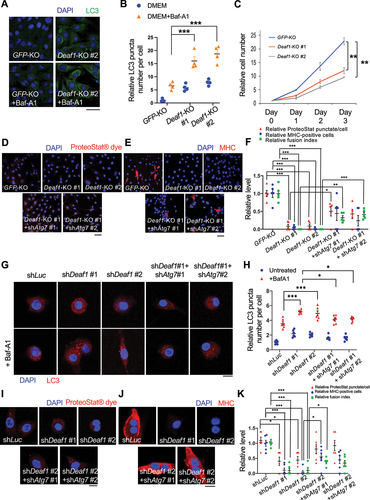
Figure 5. DEAF1 binds to promoter regions of Atg16l1 and Pik3c3 genes and suppress their transcription. (A) Consensus binding motif sequence identified from ChIP-seq data using anti-DEAF1 antibody. (B) Distribution of DEAF1 binding sites from ChIP-seq. (C) Gene ontology enrichment analysis of ChIP-seq data. (D–E) Example browser images for Pik3c3 (D) and Atg16l1 (E) from ChIP-seq in C2C12 myoblast cells using anti-DEAF1 antibody – data from two independent experiments shown. (F) DEAF1 occupancy at promoter regions of Pik3c3 and Atg16l1 genes was revealed by ChIP-qPCR. (G–I) DEAF1 suppresses Pik3c3 and Atg16l1 expression. Increased expression of Pik3c3 and Atg16l1 transcripts were observed in Deaf1-knockout cells (G) or cells expressing shDeaf1 (H), but decreased expressions occurred in cells stably expressing Deaf1 (I).
Figure 6. FOXOs target and repress Deaf1expression. (A) a putative FOXO binding site (green box; Insulin Responsive Element [IRE]) located in the proximal (2 kb) promoter region of fly and mouse Deaf1. Arrows denote ATG. (B–C) FOXO transcription factors bind to the Deaf1 promoter. ChIP was performed using young and old fly thorax (ages: 2 vs. 5 weeks) (B) or using C2C12 cells (C), followed by qPCR assay. (D–F) FOXOs suppress Deaf1 mRNA expressions in C2C12 myoblasts. RNAs from C2C12 myoblasts stably infected with lentivirus expressing shLuc, shFOXO1, or shFOXO3, or treated with AS1842856 (a FOXO1 inhibitor) or LOM612 (a FOXOs activator) were subjected to qPCR assays. (G–I) Expression of constitutively active FOXO1 or FOXO3 decreases DEAF1 protein levels. C2C12 myoblasts were transfected with activated FOXO1 (FOXO1-ADA) or FOXO3 (FOXO3-AAA) (green) were subjected to immunofluorescence with anti-DEAF1 antibody (red) and DAPI (blue) (G). DEAF1 signals in control C2C12 cells or cells expressing active FOXO1 (H) or FOXO3 (I) were quantified. Scale bar: 10 µm. (J–K) Luciferase assays using wild-type (wt) and mutant versions (ΔIRE) of the Deaf1 promoter. Removal of FOXOs binding sites (ΔIRE mutant reporters) increases the transcriptional activity of Luciferase reporters (J). The LOM612 treatment (a FOXOs activator) suppresses the Deaf1 transcription which is reversed by the removal of FOXO binding sites (K).
![Figure 6. FOXOs target and repress Deaf1expression. (A) a putative FOXO binding site (green box; Insulin Responsive Element [IRE]) located in the proximal (2 kb) promoter region of fly and mouse Deaf1. Arrows denote ATG. (B–C) FOXO transcription factors bind to the Deaf1 promoter. ChIP was performed using young and old fly thorax (ages: 2 vs. 5 weeks) (B) or using C2C12 cells (C), followed by qPCR assay. (D–F) FOXOs suppress Deaf1 mRNA expressions in C2C12 myoblasts. RNAs from C2C12 myoblasts stably infected with lentivirus expressing shLuc, shFOXO1, or shFOXO3, or treated with AS1842856 (a FOXO1 inhibitor) or LOM612 (a FOXOs activator) were subjected to qPCR assays. (G–I) Expression of constitutively active FOXO1 or FOXO3 decreases DEAF1 protein levels. C2C12 myoblasts were transfected with activated FOXO1 (FOXO1-ADA) or FOXO3 (FOXO3-AAA) (green) were subjected to immunofluorescence with anti-DEAF1 antibody (red) and DAPI (blue) (G). DEAF1 signals in control C2C12 cells or cells expressing active FOXO1 (H) or FOXO3 (I) were quantified. Scale bar: 10 µm. (J–K) Luciferase assays using wild-type (wt) and mutant versions (ΔIRE) of the Deaf1 promoter. Removal of FOXOs binding sites (ΔIRE mutant reporters) increases the transcriptional activity of Luciferase reporters (J). The LOM612 treatment (a FOXOs activator) suppresses the Deaf1 transcription which is reversed by the removal of FOXO binding sites (K).](/cms/asset/6d37d7db-993d-48d1-9a0b-557b628335f3/kaup_a_2374693_f0006_oc.jpg)
Figure 7. Modulation of Deaf1 expression levels restores muscle functions in old muscles. (A–B) Deaf1 mRNA is increased in aging MuSCs. RNA extracts from thorax of young (age: 1 week) or old (age: 6 weeks) flies (A) as well as isolated MuSCs from young (age: ~3 months) or old (age: 18 months) soleus muscles with or without AAV9-shDeaf1 injection (B) were subjected to qPCR analysis. (C) Flow chart showing the schema of mouse experiment using AAV9. (D–E) Expression of shDeaf1 improves muscle function during aging. Young (~3 months) or aged (>18 months) C57BL/6J mice were intravenously injected with AAV-shLuc (control) or AAV9-shDeaf1 and subjected to the wire hanging (D) and grip strength (E) tests on day 20. (F–L) Reduction of Deaf1 expression increases autophagy and MuSC regeneration in aging muscles. Immunostaining of soleus muscles from young or aged mice with or without freeze injury using anti-DEAF1 (green) (F), anti-MYOD1 (green) (I), anti-LC3 (green) (K), anti-ATG16L1 (green) (M), and anti-PAX7 (red) antibodies on day 20 post AAV9-mediated transduction. DEAF1 (G), PAX7 (H and J), PAX7− MYOD1+ (J), LC3 (L), and ATG16L1 (N) signals in MuSCs were quantified. Scale bar: 10 µm.
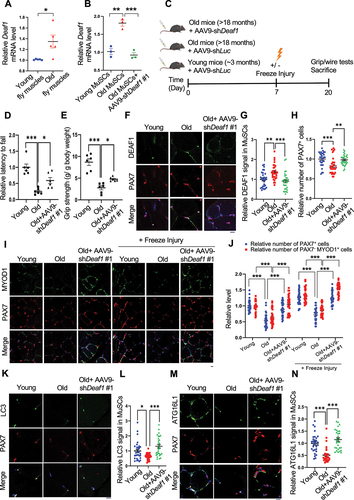
Figure 8. DEAF1 reduction induced by FOXO activation restores autophagy and improves muscle regeneration in aged MuSCs. (A) Schematic representation of the experimental design. (B–J) Young, aged mice, or aged mice with intramuscular injection of a FOXO activator, LOM612, were subjected to freeze injuries, followed by immunostaining using anti-DEAF1 (green) (B), anti-MYOD1 (green) (E), anti-LC3 (green) (G), anti-ATG16L1 (green) (I), and anti-PAX7 (red) antibodies. DEAF1 (C), PAX7 (D and F), PAX7− MYOD1+ (F), LC3 (H), and ATG16L1 (J) signals in MuSCs were quantified. Scale bar: 10 µm.
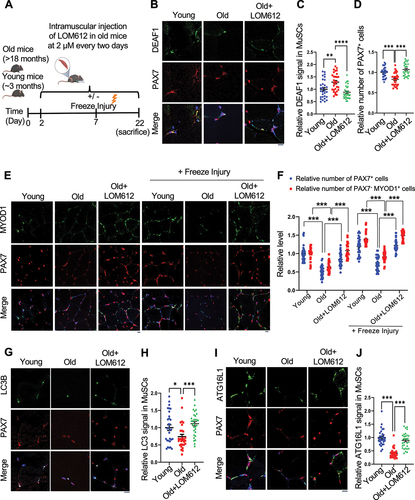
Figure 9. Enhanced Deaf1 expression relieves muscle atrophy under cachectic conditions. (A–B) Deaf1 mRNA is decreased in cachectic MuSCs. RNAs extracts from thorax of control (esg-Gal4, UAS-GFP, tubGal80ts or EGT) or cachectic flies (EGT; UAS-yki3SA) (A) as well as from isolated MuSCs of NOD/SCID mice (~3 months) with or without LL2 cachectic cell implantation, followed by AAV9-Deaf1 injection (B) were subjected to qPCR analysis. (C) Flow chart showing the details of mouse experiment using AAV9. (D–E) Augmented Deaf1 level increases muscle strength during cancer cachexia. Purified AAV9-Deaf1 viruses were systemically delivered using intravenous (IV) injection into NOD/SCID mice bearing LL2 tumors. After 21 days, muscle strength and function of young and aging mice was assessed by wire-hang (D) and grip strength (E) analyses. (F–N) an increase in Deaf1 expression represses autophagy and relieves muscle atrophy induced by cancer cachexia. Immunostaining of soleus muscles from NOD/SCID mice bearing LL2 tumors or LL2 tumors with AAV-Deaf1 IV injection using anti-DEAF1 (green) (F), anti-MYOD1 (green) (I), anti-LC3 (green) (K), anti-ATG16L1 (green) (M), and anti-PAX7 (red) antibodies. DEAF1 (G), PAX7 (H and J), PAX7− MYOD1+ (J), LC3 (L), and ATG16L1 (N) signals in MuSCs were quantified. Apoptotic cells were detected by ApopTag® in situ Apoptosis Detection Kit and quantified in (J). Scale bar: 10 µm.
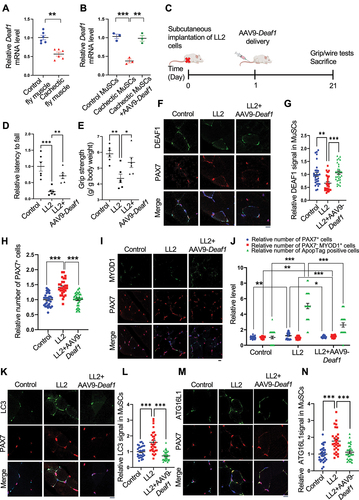
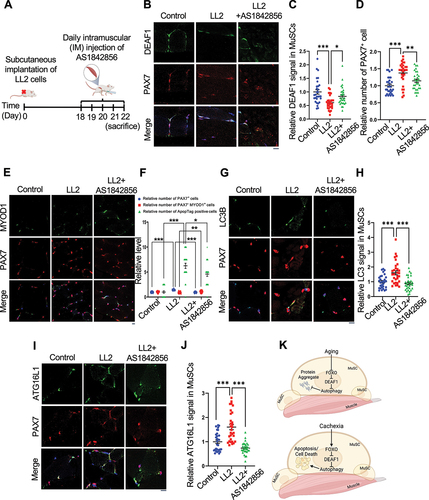
Figure 10. FOXO1 inactivation increases Deaf1 expression and improves muscle defects induced by cancer cachexia. (A) Schematic representation of the experimental design. (B–J) Immunostaining of soleus muscles from control mice or mice bearing LL2 tumors intramuscularly injected with a FOXO1 inhibitor, AS1842856, using anti-DEAF1 (green) (B), anti-MYOD1 (green) (E), anti-LC3 (green) (G), anti-ATG16L1 (green) (I), and anti-PAX7 (red) antibodies. DEAF1 (C), PAX7 (D and F), PAX7− MYOD1+ (F), LC3 (H), and ATG16L1 (J) signals in MuSCs were quantified. Apoptotic cells were detected by ApopTag® in situ Apoptosis Detection Kit and quantified in (F). Scale bar: 10 µm. (K) Working model. Model showing that aging enhances Deaf1 expression through FOXO signaling to transcriptionally suppress autophagy and in turn increase protein aggregates in MuSCs. In contrast, cachectic cancers activate FOXO to reduce Deaf1 expression and promote autophagy, leading to cell death. Modulation of Deaf1 levels can improve muscle atrophy induced by aging and cancer cachexia. Created with BioRender.com.
Supplemental Information 20240618.docx
Download MS Word (12.5 MB)Data availability statement
ChIP-seq data has been submitted to GEO (GSE237088). Code to recreate the reported ChIP-seq and transcriptomic analyses are available from https://github.com/harmstonlab/Goh_et_al_deaf1.