
Figures & data
Table 1. Demographic characteristics and employment conditions for the three different employee groups.
Figure 1. Structural model with standardized parameter estimates. Note: ***p < 0.001; *p < 0.05. Dotted line indicates non-significant relationship. N = 10,096.
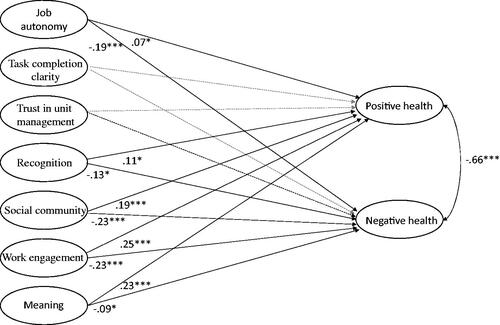
Table 2. Means, standard deviation (SD), average variance extracted (AVE), and squared correlations of latent variables (SC).
Table 3. Means and standard deviation (SD) for latent variables for all groups, by gender and employee group.
Table 4. Gender and employee group differences in the mean level of the psychological needs (MG-CFA).
Table 5. Path coefficients of the multi-group structural equation model (MG-SEM), by gender and employee group.