
Figures & data
Figure 1. Representation of the literature selection process based on the PRISMA method (cf. Moher et al., Citation2009).
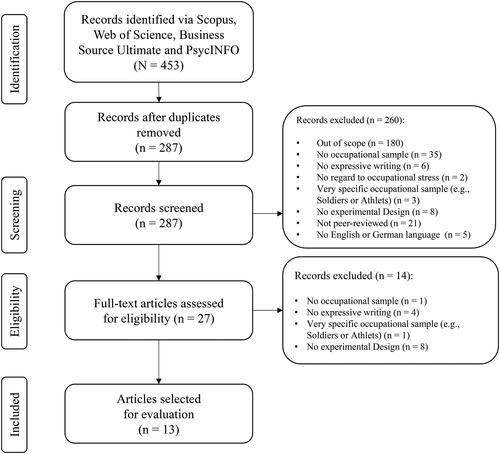
Table 1. Tabular comparison of the internal validity threats of the studies analyzed in the review.
Table 2. Tabular comparison of the studies analyzed in the review.
Figure 2. Graphical representation of the positive effects of expressive writing depending on the study design and intervention protocol.
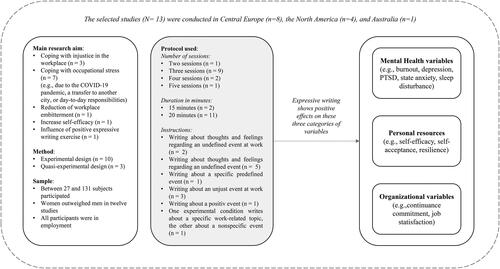
Table 3. Tabular comparison of intervention protocols used for expressive writing.