Figures & data
Table 1. Interviews.
Figure 1. Non-EU labour migrant quota totals 1996–2020.
Source: Author’s elaboration on basis of data from the Ministero del Lavoro e delle Politiche Sociale.
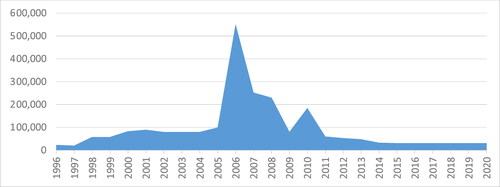
Figure 2. Non-EU labour migrant quota composition 1996–2020.
Source: Author’s elaboration based on data from the Ministero del Lavoro e delle Politiche Sociale, cross-checked with (Callia et al., Citation2012; Perna, Citation2019).
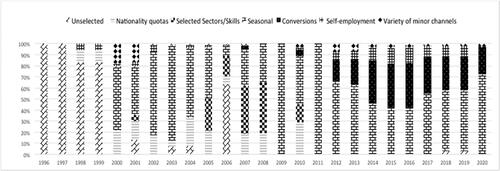
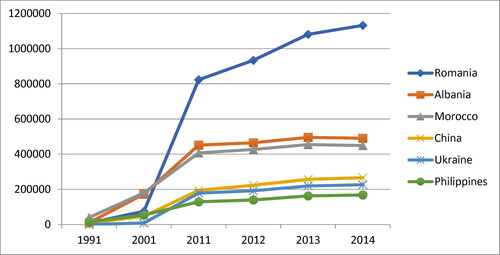
Figure 3. Growth of principal foreign communities in Italy 1991–2014.
Source: Author’s elaboration based on ISTAT data on residents by citizenship.