
Figures & data
Figure 1. Scheme of the two-compartment model. Dp.o. is the oral dose given. G is the gut. A is the rest of the body; kf is the rate of removal of DMSA from the gut into the faeces; ka is the rate of absorption from the gut into the rest of the body; kb is the rate of removal of DMSA from the body into the gut; ku is the rate of removal of DMSA from the body into urine. Note that ks = kb + ku and kg = ka + kf are parameters to be fitted.
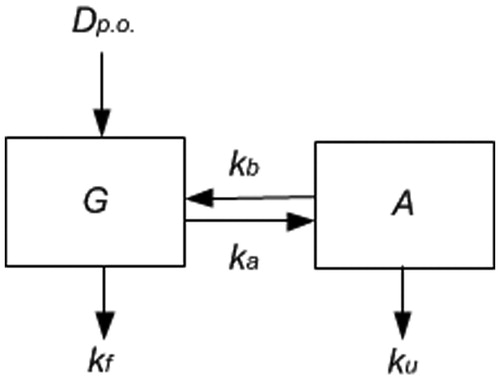
Table 1. Characteristics of the healthy volunteers used for model calibration and model verification.
Table 2. Computer fitted model parameters (geometric mean and 95% confidence interval).
Figure 2. Model simulations of the individual experimental data from the Asiedu’s study [Citation16] (N = 3 subjects: 1, 2 and 3). The measured total DMSA concentrations in plasma are represented by symbols and the predicted ones by a continuous line.
![Figure 2. Model simulations of the individual experimental data from the Asiedu’s study [Citation16] (N = 3 subjects: 1, 2 and 3). The measured total DMSA concentrations in plasma are represented by symbols and the predicted ones by a continuous line.](/cms/asset/4999ecbd-407d-43c0-a451-58429e40914c/ictx_a_1221508_f0002_b.jpg)
Figure 3. Simulated versus observed plasma concentrations and urine excretion of DMSA following oral administration of 10 mg/kg bodyweight in healthy human volunteers. Observed data are presented as mean ±95% CI.
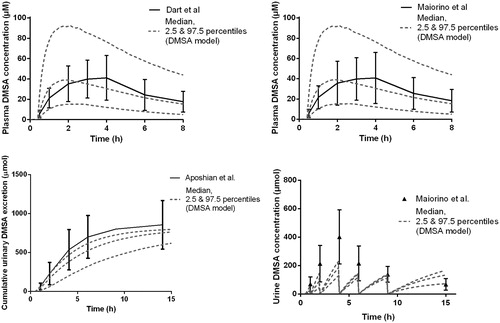
Table 3. Comparison of the predicted values with the experimental data for DMSA plasma and urine concentrations (ratios of AUC and ratios of Cmax values).