Figures & data
Figure 1. Schematic diagram of the CLT model. In grey, on the right side of the diagram, the succimer kinetic model has been combined with the PBPK lead model developed by O’Flaherty.
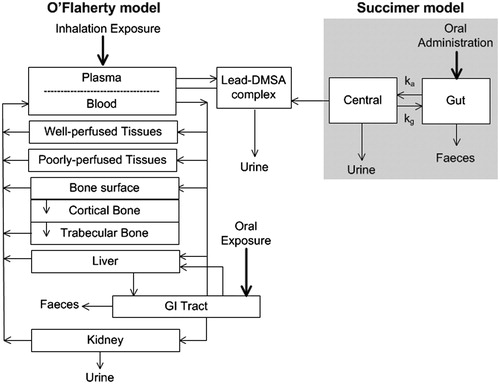
Table 1. Patients’ demographics (patients used to fit the parameters in this study).
Figure 2. Simulations of the blood [Patient A (panel 2A) and Patient B (panel 2B)] and urine [Patient A (panel 2C) and Patient B panel 2D)] lead concentrations by the CLT model, in two patients. Patient A is an example of acute lead intoxication by traditional remedies and Patient B an example of chronic occupational lead exposure. Symbols represent the measured values (“○” for blood lead concentrations) and “∇” for urine lead concentrations) and the continuous lines represent the predictions of the CLT model. The arrows indicate the start and end of each chelation course.
![Figure 2. Simulations of the blood [Patient A (panel 2A) and Patient B (panel 2B)] and urine [Patient A (panel 2C) and Patient B panel 2D)] lead concentrations by the CLT model, in two patients. Patient A is an example of acute lead intoxication by traditional remedies and Patient B an example of chronic occupational lead exposure. Symbols represent the measured values (“○” for blood lead concentrations) and “∇” for urine lead concentrations) and the continuous lines represent the predictions of the CLT model. The arrows indicate the start and end of each chelation course.](/cms/asset/6d9c7720-e4b1-4f9b-a58f-f310bfc7cbbf/ictx_a_1263855_f0002_b.jpg)
Table 2. Results of the parameter estimation.
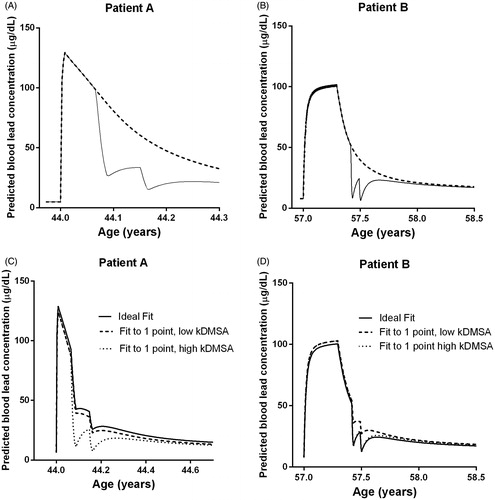
Figure 3. Sensitivity analyses of the CLT model for Patients A and B. The graphs show the dependency of the blood [Patient A (panel 3A) and Patient B (panel 3B)] and urine [Patient A (panel 3C) and Patient B (panel 3D)] lead concentrations on the accuracy of the chosen lead–succimer apparent association constant (kapp). Predictions with the individually fitted lead–succimer apparent association constant are indicated by the continuous line. Predictions by varying the lead–succimer apparent association constant are indicated by dotted lines.
![Figure 3. Sensitivity analyses of the CLT model for Patients A and B. The graphs show the dependency of the blood [Patient A (panel 3A) and Patient B (panel 3B)] and urine [Patient A (panel 3C) and Patient B (panel 3D)] lead concentrations on the accuracy of the chosen lead–succimer apparent association constant (kapp). Predictions with the individually fitted lead–succimer apparent association constant are indicated by the continuous line. Predictions by varying the lead–succimer apparent association constant are indicated by dotted lines.](/cms/asset/16842306-2a6b-49ce-92ee-ae6fd368dcfe/ictx_a_1263855_f0003_b.jpg)
Figure 4. Determined (symbols) and predicted (continuous line) blood lead concentrations of the seven patients included in the present study. Predictions were made with the CLT model.
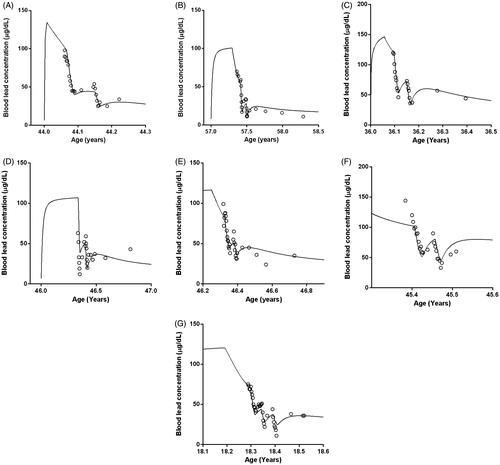
Figure 5. Panels (A) and (B) show the predicted blood lead concentration with (—) and without (- - -) succimer chelation therapy. Panels (C) and (D) show the difference between the situation in which blood lead concentrations have been measured several times (continuous line, “Ideal Fit”) and the situation in which only the first blood lead concentration is available before starting the chelation therapy (dotted lines). In the ideal fit, the lead–succimer apparent association constant was fitted individually. In the situation where only one blood concentration is known, predictions were performed with the lowest and the highest fitted value of the lead–succimer apparent association constant determined among the seven patients included in this study (respectively, 6.0 × 10³/mmol and 20 × 103/mmol).