Figures & data
Table 1. Admission laboratory data in the patients with acute serum LT measurements (Group I) and in the follow-up group of survivors 2 years after discharge (Group II).
Figure 1. Box-and-whisker plots of serum LT concentrations measured during hospitalization and in the survivors 2 years after discharge (Follow-up). Acute Cmax – maximum serum LT concentrations measured during hospitalization; Acute Cmean – mean serum LT concentrations during the observation period with acute methanol poisoning. Mean (dotted line), standard error of the mean (SEM, box), and 95%CI of the mean (whiskers) are presented. ***p < 0.001.
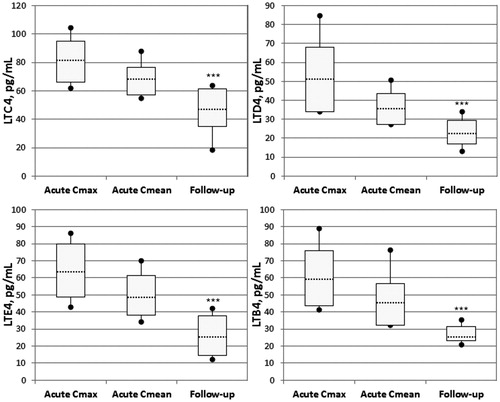
Table 2. Serum LT concentrations measured during hospitalization (Group I) and in the follow-up group of survivors (Group II) 2 years after discharge (means ± CI95%)Table Footnoteb.
Figure 2. Dynamics of acute serum LT concentrations changes during the observation period in the patients hospitalized with acute methanol poisoning.
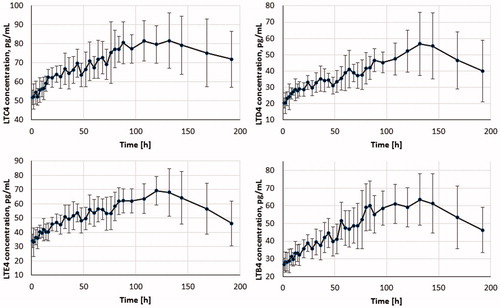
Table 3. Follow-up serum LT concentrations measured 2 years after discharge (Group II) in survivors without sequelae versus survivors with long-term visual and/or CNS sequelae of poisoning (n = 36; means ± CI95%)Table Footnotea.
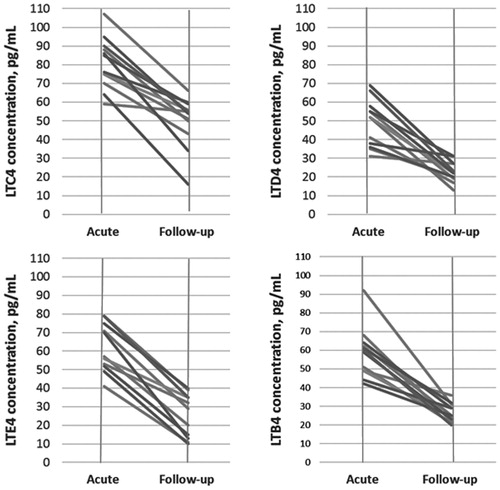
Figure 3. Decrease of serum LT concentrations measured during hospitalization (“Acute”) versus LT concentrations measured 2 years after discharge in the same patients (“Follow-up”).