Figures & data
Table 1. Cases of HIE use.
Figure 1. Minimum BSL vs maximum insulin infusion rate (a) and total insulin (b). Mean regression line (thick black) and 95% confidence intervals (dashed black).
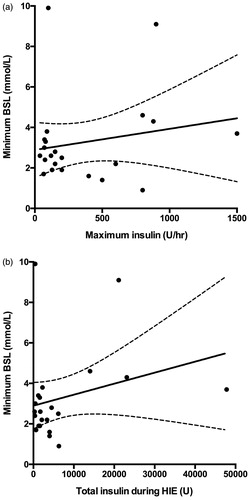
Figure 2. Minimum BSL in verapamil and beta blocker overdose patients p value = 0.22.
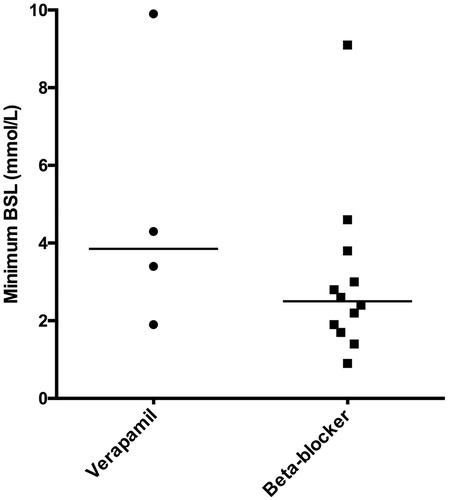
Figure 3. Total insulin administered versus minimum serum potassium (a), potassium replacement (b), minimum serum magnesium (c) and minimum serum phosphate (d). Mean regression line (thick black) and 95% confidence intervals (dashed black).
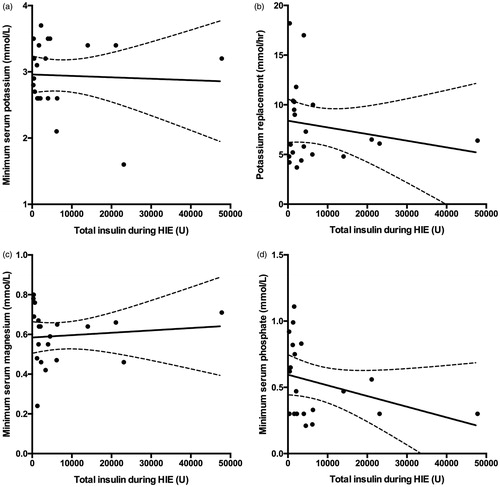
Figure 4. Maximum insulin infusion rate versus maximum glucose replacement (a), and total insulin administered versus total glucose during HIE (b). Mean regression line (thick black) and 95% confidence intervals (dashed black).
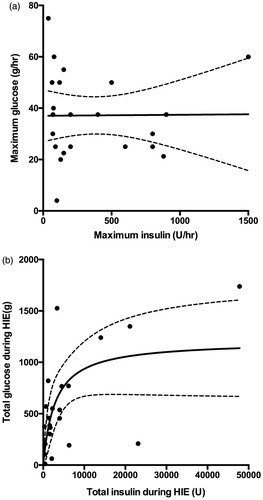
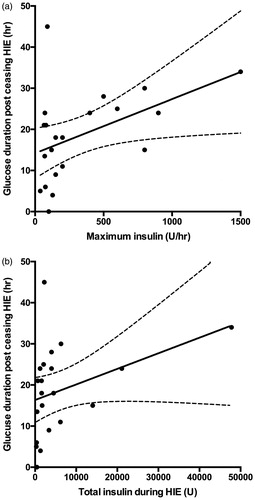
Figure 5. Glucose duration versus maximum insulin infusion rate (a) and total insulin administered (b) during HIE. Mean regression line (thick black) and 95% confidence intervals (dashed black).