Figures & data
Figure 1. Effects on sedation (A) and temperature (B) in Sprague–Dawley rats of intraperitoneal (IP) 75 mg/kg tramadol administration followed 15 min later by IP 4% tween + intravenous (IV) saline (Control group, black), IP 1.77 mg/kg diazepam + IV saline (diazepam group, horizontal lines), IP 4% tween + IV 2 mg/kg bolus followed by 4 mg/kg/h naloxone (Naloxone group, vertical lines), or IP 1.77 mg/kg diazepam + IV 2 mg/kg bolus followed by 4 mg/kg/h naloxone (diazepam/naloxone group, white). Results are expressed as median (percentiles; N = 6/group). *p < .05.
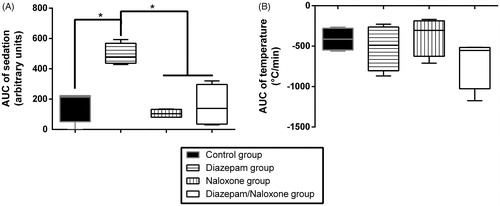
Figure 2. Effects on the time-course (A) and intensity (B) of seizures in Sprague–Dawley rats of intraperitoneal (IP) 75 mg/kg tramadol administration followed 15 min later by IP 4% tween + intravenous (IV) saline (Control group, black), IP 1.77 mg/kg diazepam + IV saline (diazepam group, horizontal lines), IP 4% tween + IV 2 mg/kg bolus followed by 4 mg/kg/h naloxone (Naloxone group, vertical lines), or IP 1.77 mg/kg diazepam + IV 2 mg/kg bolus followed by 4 mg/kg/h naloxone (diazepam/naloxone group, white). Each dot represents one seizure. Results are expressed as median (percentiles; N = 6/group). **p < .01 and ****p < .0001 between Naloxone and diazepam groups; °°p < .01 and °°°°p < .0001 between Naloxone and diazepam/naloxone groups; ##p < .01 between Naloxone and control groups.
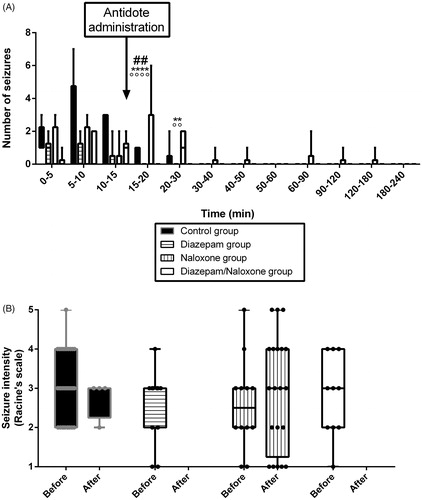
Figure 3. Effects on plethysmography parameters in Sprague–Dawley rats of intraperitoneal (IP) 75 mg/kg tramadol administration followed 15 min later by IP 4% tween + intravenous (IV) saline (control group, black), IP 1.77 mg/kg diazepam + IV saline (diazepam group, horizontal lines), IP 4% tween + IV 2 mg/kg bolus followed by 4 mg/kg/h naloxone (naloxone group, vertical lines), or IP 1.77 mg/kg diazepam + IV 2 mg/kg bolus followed by 4 mg/kg/h naloxone (diazepam/naloxone group, white). TI represents the inspiratory time, TE the expiratory time, VT, the tidal volume and VM the minute volume. Areas under the effect-time curve (AUC) were determined. Results are expressed as median (percentiles). Comparisons between groups were performed two by two using Mann–Whitney tests. (N = 6/group). *p < .05.
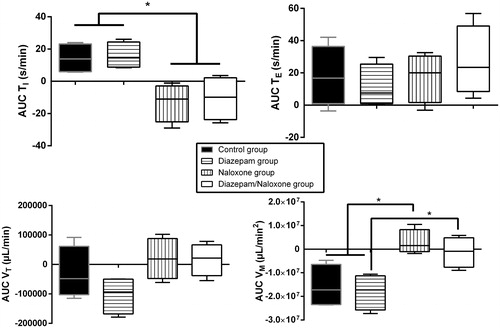
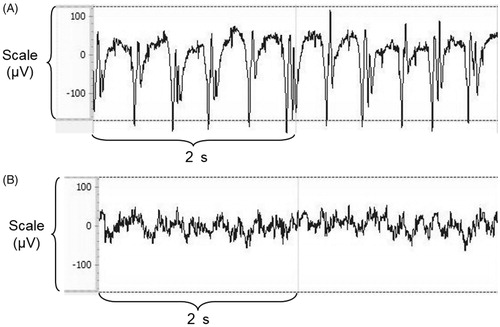
Figure 4. Rat electroencephalogram traces showing tramadol-induced electrical seizures (A) and its reversal after diazepam/naloxone administration (B).