
Figures & data
Table 1. Baseline biochemical values (median (25th–75th)).
Figure 1. Example of a plasma concentration time curve in one subject after fasting. Samples were measured by (A) the enzymatic colorimetric assay method or by (B) LC-MS/MS.
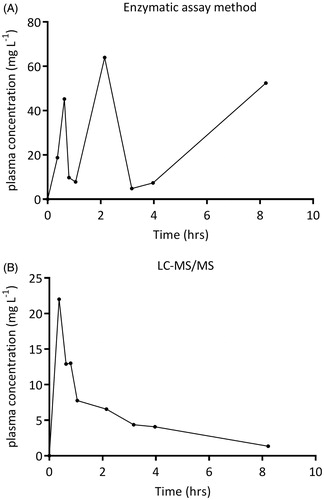
Figure 2. Bland–Altman plots of differences between the LC-MS/MS method and the enzymatic colorimetric assay in (A) control samples, (B) after fasting and (C) after a high-fat diet. The dashed line represents the mean difference between the methods, and the dotted line indicates the upper and lower limit of agreement, set to ±2SD of the mean difference.
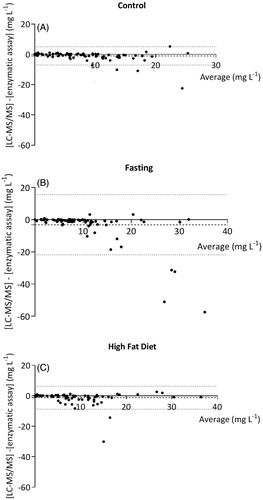
Figure 3. The median (interquartile range) plasma concentration versus time curve of acetaminophen in three different nutritional conditions. The closed line represents control samples, the dotted line represents fasting samples and the dashed line represents the high-fat diet samples. Concentrations were measured by LC-MS/MS.
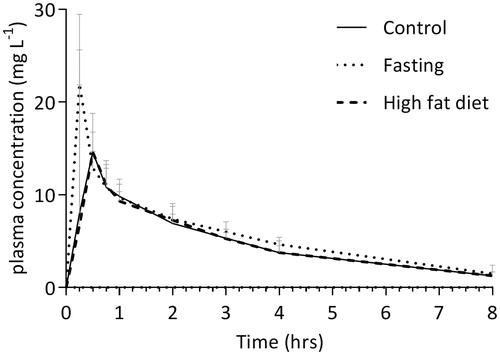
Figure 4. Individual AUC0–8h of acetaminophen in subjects receiving oral dose of 1000 mg acetaminophen after (A) fasting or after (B) a high-fat diet, compared to the AUC0–8h of acetaminophen after the regular control diet.
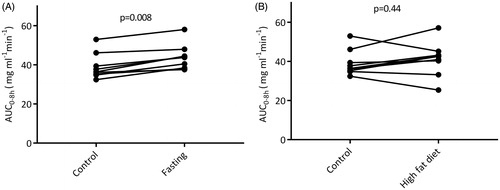
Table 2. Pharmacokinetic parameters of acetaminophen in the three different nutritional conditions based on LC-MS/MS measurements.