
Figures & data
Table 1. Demographic and laboratory data of the study population and the control group (means with SD).
Figure 1. P1 latency of visual evoked potentials in the study population (n = 42) versus controls (n = 41). OD: oculus dexter; OS: oculus sinister; ms: : milliseconds; “6 months”, “24 months”, “48 months”: clinical examinations performed after discharge from hospital; ***p < .001; **p < .01; *p < .05.
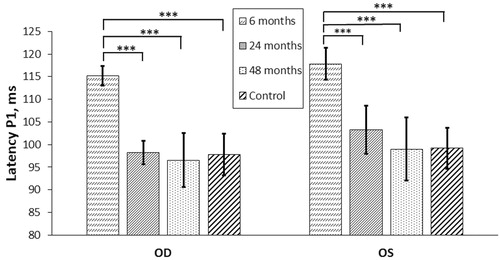
Figure 2. Dynamics of P1 latency changes during the observation period depending on arterial blood pH at admission. OD: oculus dexter; OS: oculus sinister; Latency: : mean P1 latency, ms; pH: arterial blood pH measured on admission to hospital.
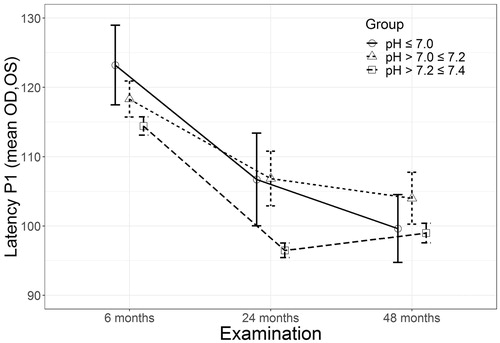
Table 2. Mixed effect model predicting changes of P1 latency during four years of observation.
Figure 3. (A) N1P1 amplitude of VEPs in the study population (n = 42) versus control group (n = 41). (B) N1P1 amplitude of VEPs in the patients with the amplitude of at least 1.0 mcV in at least one eye during the observation period (n = 17) versus control group (n = 41). OD: oculus dexter; OS: oculus sinister; ms: milliseconds; “6 months”, “24 months”, “48 months”: clinical examinations performed after discharge from hospital; ***p < .001; **p < .01; *p < .05.
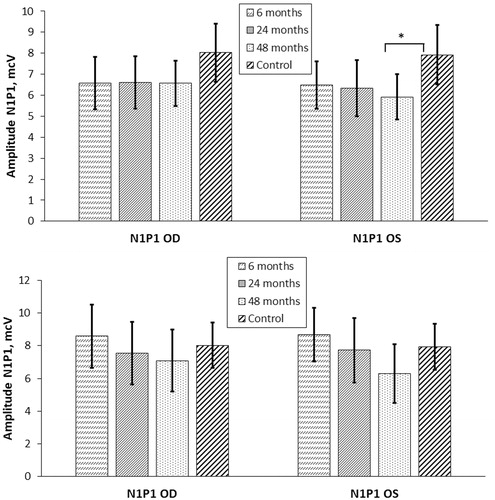
Table 3. Apolipoprotein E genotype and allele distribution between the study population and general czech populationa.
Table 4. The association of ApoE genotype group (ApoE2/E2(E3/E2) versus ApoE3/E3 versus ApoE4/E3(E4/E4)) with chronic structural and functional changes of the visual pathway during the observation period (n = 41).
Table 5. Apolipoprotein E genotype group (ApoE4 carriers versus non-carriers) and chronic structural and functional changes of the visual pathway during the observation period (n = 41).