
Figures & data
Table 1. Demographics, exposure characteristics, level of care and medical outcome of all accidental exposures to liquid laundry packets by period of ASTM safety standard implementation.
Figure 1. Frequency of all accidental exposures to Liquid Laundry Packets by level of severity. *HCF: healthcare facility; Clinically significant outcome categories of HCF Evaluation, HCF Admission, and Major Medical Outcome were not mutually exclusive. Each horizontal line represents exposures with a different level of severity category. The vertical lines represent the start/stop of the baseline, transition, and post periods. The lower panel represents a subset of the top panel, displaying only HCF admissions and major medical outcomes.
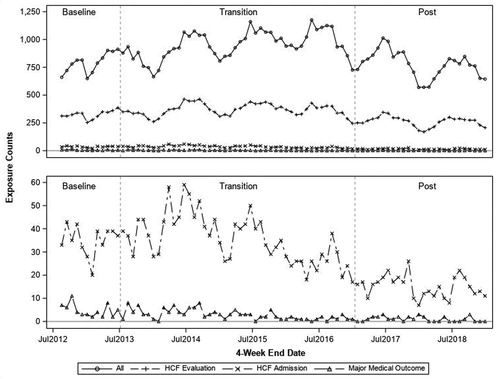
Figure 2. Liquid laundry packet sales. The vertical lines represent the start/stop of the baseline, transition, and post periods.
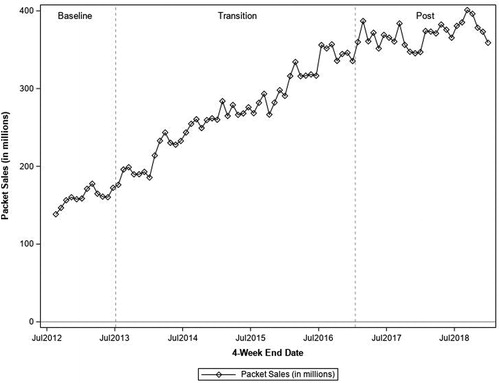
Figure 3. Sales adjusted rates of all accidental exposures to liquid laundry packets by level of severity. *HCF: healthcare facility; Clinically significant outcome categories of HCF Evaluation, HCF Admission, and Major Medical Outcome were not mutually exclusive. Each horizontal line represents sales adjusted exposures with a different level of severity category. The vertical lines represent the start/stop of the baseline, transition, and post periods. The lower panel represents a subset of the top panel, displaying only HCF admissions and major medical outcomes.
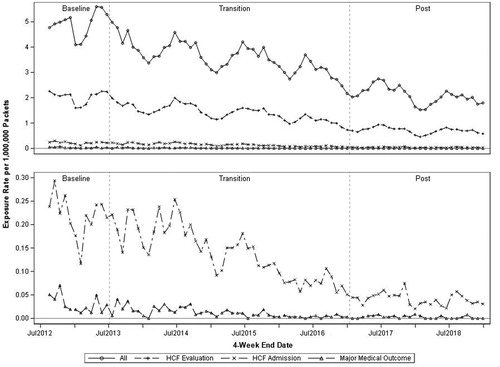
Table 2. Cumulative sales adjusted rates of all accidental exposures to liquid laundry packets in children <6 years old by period of ASTM safety standard implementation.
Data availability statement
The data used for this analysis are available from the American Association of Poison Control Centers.