
Figures & data
Figure 1. Flow diagram of exposures included in this study.
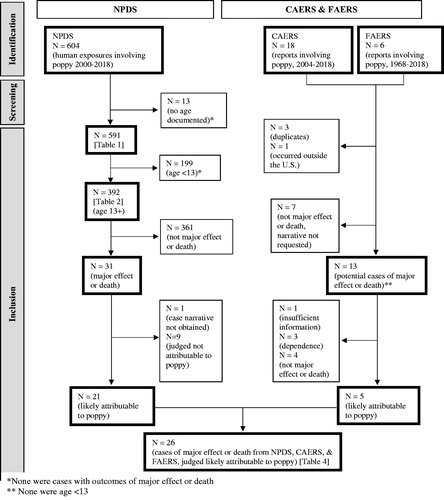
Table 1. Intentionality and Outcome of NPDS Exposures Indicating Poppy, 2000–2018, by Agea.
Table 2. Characteristics of NPDS Exposures Indicating Poppy, Age 13+, 2000–2018, by Intentionalitya.
Table 3. Route of Exposure, Symptoms, Therapies, and Management Site in NPDS Single-Product Exposures Indicating Poppy, Age 13+, 2000–2018a.
Figure 2. Annual rate of NPDS exposures indicating poppy, 2000–2018a. aCall rates were adjusted for the decline in overall volume of National Poison Data System exposure cases by normalizing reporting rates to 2000.
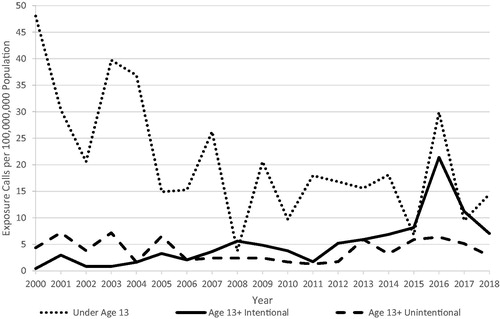
Table 4. Poppy-related overdoses and deaths in the United States from CAERS (2004–2018), FAERS (1968–2018), and NPDS (2000–2018).