Figures & data
Figure 1. Omethoate inhibits AChE more strongly than dimethoate, cyclohexanone or cyclohexanol. (A–D) Activity of eel AChE is inhibited by (A) omethoate (IC50 about 3 µM) but much less so by (B) dimethoate (IC50 about 5 mM), (C) cyclohexanol (IC50 about 25 mM) and (D) cyclohexanone (IC50 about 40 mM, about 40-fold greater than plasma concentration measured after insecticide gavage [Citation25]). Red arrows indicate the peak circulating concentrations of these compounds following insecticide gavage [Citation27]. (E,F) Cyclohexanol (5 mM) was a weak inhibitor of AChE activity in (E) diaphragm muscle extracts and (F) FDB muscle extracts. Bars show mean ± SEM. Surprisingly, cyclohexanol reduced the inhibitory effect of 10 µM omethoate by 50% but had no effect at 100 µM omethoate. (G–I) Omethoate, but not cyclohexanol, blocked histochemical staining for AChE at motor endplates in mouse FDB muscle. (G) control endplates showing strong histochemical AChE staining (arrows); (H) pre-incubation in cyclohexanol (20 mM) did not block AChE staining at NMJs while (I) pre-incubation in 100 µM omethoate blocked all AChE staining.
![Figure 1. Omethoate inhibits AChE more strongly than dimethoate, cyclohexanone or cyclohexanol. (A–D) Activity of eel AChE is inhibited by (A) omethoate (IC50 about 3 µM) but much less so by (B) dimethoate (IC50 about 5 mM), (C) cyclohexanol (IC50 about 25 mM) and (D) cyclohexanone (IC50 about 40 mM, about 40-fold greater than plasma concentration measured after insecticide gavage [Citation25]). Red arrows indicate the peak circulating concentrations of these compounds following insecticide gavage [Citation27]. (E,F) Cyclohexanol (5 mM) was a weak inhibitor of AChE activity in (E) diaphragm muscle extracts and (F) FDB muscle extracts. Bars show mean ± SEM. Surprisingly, cyclohexanol reduced the inhibitory effect of 10 µM omethoate by 50% but had no effect at 100 µM omethoate. (G–I) Omethoate, but not cyclohexanol, blocked histochemical staining for AChE at motor endplates in mouse FDB muscle. (G) control endplates showing strong histochemical AChE staining (arrows); (H) pre-incubation in cyclohexanol (20 mM) did not block AChE staining at NMJs while (I) pre-incubation in 100 µM omethoate blocked all AChE staining.](/cms/asset/aad59f8c-5861-4705-b1c4-eb1f1cf674e3/ictx_a_1916519_f0001_c.jpg)
Figure 2. Omethoate potentiates twitch contraction but induces tetanic fade.(A,B) MMG responses of pelvic limb extensor muscle contractions in an anaesthetized pig in response to 2 Hz TOF stimulation (T1–T4) before (A) and 30 min after (B) i.v. infusion of 40 mg kg−1 omethoate. Twitch force increased for all four stimuli (T1–T4) with omethoate but also showed some T1–T4 fade. (C,D) Summary data showing (C) potentiation of T1 twitch force in the MMG and (D) T1–T4 fade, with increasing doses of i.v. omethoate. Fade was consistently reduced after omethoate was increased from 20 mg kg−1 to 40 mg kg−1. Each connected set of points represents data from one animal. (E,F) Averaged tetanic MMG responses with 95% confidence limits (shading) from 8 pigs before (E) and 30 min after (F) omethoate infusion. Before omethoate, tetani were well sustained. However, 30 min after omethoate, the initial peak tetanic force was reduced and showed marked fade during stimulation. (G) Summary data showing peak tetanic force before (CON) and 30 min after i.v. infusion of 40 mg kg−1 omethoate (Ometh). Peak force was less after omethoate in 7/8 animals. (H) Summary data showing peak tetanic force 30 min after i.v. infusion of 40 mg kg−1 omethoate, expressed as a percentage of the peak tetanic response before infusion (%CON) and the amount of tetanic fade at 250, 500 and 750 ms expressed as a % of each muscle’s peak tetanic force. Consistency of tetanic fade between muscles was confirmed by paired Wilcoxon test (p < 0.002 comparing tetanic force at 250 ms and 750 ms in each case).
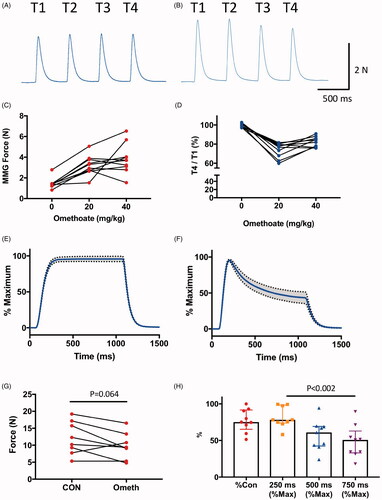
Figure 3. Infusion of MgSO4 in isotonic saline mitigated tetanic fade induced by omethoate. (A) MMG recordings of pig pelvic limb extensor muscle contractions in response to tetanic (50 Hz, 1 s) stimulation in an anaesthetized pig receiving two infused doses of omethoate (40 mg kg−1), each followed by a MgSO4 bolus (50 mg kg−1). The first omethoate dose produced modest tetanic fade, improved by MgSO4. A second omethoate dose 1 h later gave rise to more marked tetanic fade by 30 min; following a further MgSO4 dose, there was substantial albeit incomplete recovery and maintenance of the tetanic MMG response. (B,C) Summary data from six experiments showing recovery of peak tetanic force (B) and fade (C) after MgSO4 infusion. Reduced %Peak represents greater fade. p = 0.31 in both B and C, Wilcoxon Test.
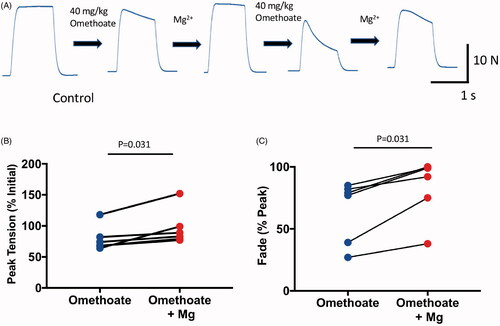
Figure 4. Cyclohexanol causes concentration-dependent attenuation of neuromuscular responses. (A) Graph of peak MMG twitch responses during TOF (T1–T4) stimulation in an anaesthetised pig. The change in the apparent line thickness throughout the trace in (A,G) indicates the amount of T1–T4 fade. Omethoate potentiated twitch contractions and initially produced discernible TOF fade but this decreased with time. Infusion of cyclohexanol at times and doses indicated progressively abolished TOF contractions. (B–F) Examples of TOF responses obtained 30 min after each omethoate or cyclohexanol dose indicated by arrows in (A). After initial omethoate infusion, twitch force increased with marked T1–T4 fade. Twitch force increased with further omethoate but fade reduced. Cyclohexanol reduced twitch force almost immediately and enhanced T1–T4 fade. A larger dose of cyclohexanol substantially reduced and equilibrated all four twitch responses. (G) Graph of peak MMG twitch responses during TOF (T1–T4) stimulation in an anaesthetised pig receiving only cyclohexanol. Infusion of increasing doses of cyclohexanol progressively abolished TOF contractions. (H–J) Traces obtained 30 min after each cyclohexanol dose indicated in (G). Twitch depression was apparent after each dose with progressive decrease in the T4/T1 ratio but there was partial recovery with time. Responses were substantially reduced in amplitude and showed marked T4/T1 fade after the highest dose (500 mg kg−1) of cyclohexanol. (K) MMG response to tetanic stimulation (40 Hz, 2 s) after administration of 500 mg kg−1 cyclohexanol, immediately prior to euthanasia at the study’s end, showing marked and rapid fade following an initial tension summation (Compare with response to omethoate, ). (L–M) Summary data from 7 pigs, showing significant reduction in T1 twitch force and T4/T1 fade ratio 30 min after infusion of increasing doses of cyclohexanol (**p < 0.02; ANOVA post hoc Dunnett’s test). Bars show mean ± SEM. Recordings from one of the seven pigs showed no apparent change but, overall, fade increased by about 50% (p < 0.001, paired t-test).
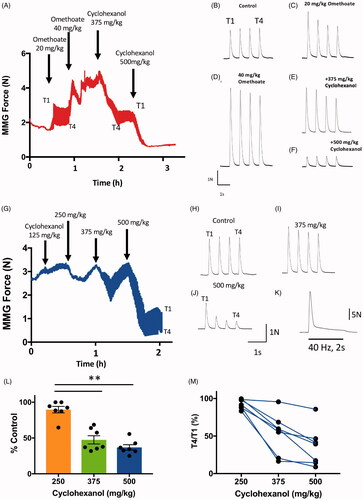
Figure 5. Reducing core temperature mitigated effects of cyclohexanol on MMG response. (A–D) Continuous records of peak MMG tension during TOF stimulation in four anaesthetised pigs following infusion of cyclohexanol (500 mg kg−1) then application of cooling measures to reduce core temperature to 34–35 °C, showing partially reversal of (A–C) or arrested (D) decline in MMG tension. Deterioration in the MMG resumed on re-warming. (E–L) Measurements of MMG twitch duration, based on rise times (E–H) and half-width (I–L), during the same experiments. The recordings show that cooling reversibly increases these measures of muscle function. Line thicknesses indicate the upper (T1) and lower (T4) bounds of these measures of MMG responses.
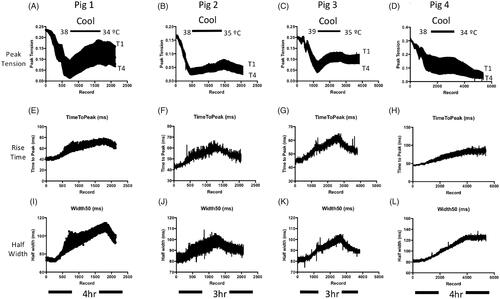
Figure 6. Aftercontractions of isolated FDB muscles are reversibly mitigated by increasing extracellular Mg2+. (A–F) Isometric force recordings in response to 50 Hz stimulation for 1 s, from a mouse FDB muscle following omethoate (150 µM) incubation for 1 h showing marked aftercontractions (B) compared to control (A). Increasing Mg2+ concentration to 2 mM (C), 3 mM (D) and 5 mM (E) progressively reduced, then abolished, the aftercontraction while preserving the tetanic response. (F) Aftercontractions immediately resumed after restoring Mg2+ to 1 mM. (G) Summary data showing magnitude and decay of aftercontractions following 1 h incubation in 150 µM omethoate (t = 0 on x-axis) with 1 mM Mg2+ (red symbols) or 5 mM Mg2+ (cyan symbols). Preparations incubated only in MPS showed no aftercontraction (black line). (H) Summary data showing aftercontractions after incubation for 1 h in a solution containing omethoate and 1 mM Mg2+ (red) or 5 mM Mg2+ (cyan). Aftercontractions were restored 30 min after reducing the 5 mM Mg2+ concentration to 1 mM (magenta).
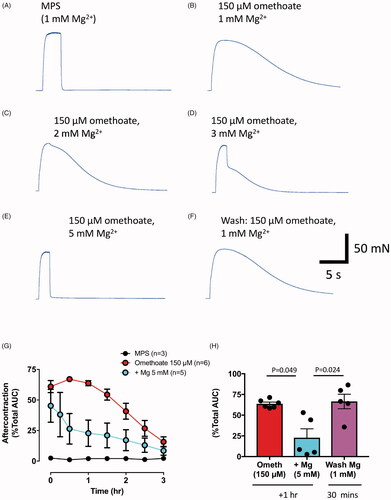
Figure 7. Cyclohexanol enhances then rapidly blocks twitch responses. (A–E) TOF tension responses of a mouse FDB nerve-muscle preparation showing twitch potentiation before (A) and after (B) incubation in omethoate (150 µM) for 1.5 h. (C) Twitches were further potentiated and prolonged by tension summation within 1 min of adding 10 mM cyclohexanol; (D,E) however, by 2 min, the tension responses, while still prolonged, became markedly reduced. (F) Summary of continuous, integrated tension responses in four experiments similar to A–D. Each point is the mean ± SEM of integrated 2 Hz TOF responses sampled at 10 s intervals, showing initial potentiation then depression and block of the evoked tension responses.
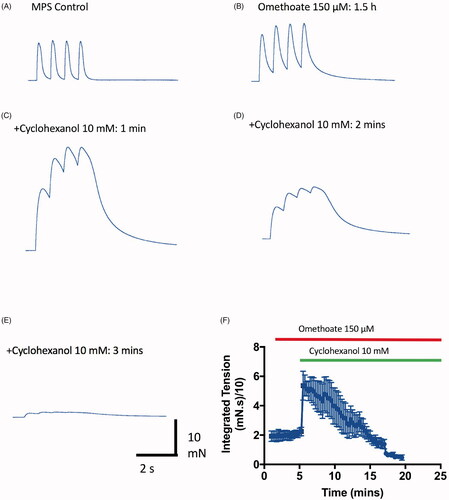
Figure 8. Cyclohexanol causes concentration-dependent and temperature sensitive neuromuscular fade and block in isolated mouse FDB muscles. (A–F) TOF responses of an isolated mouse FDB nerve-muscle preparation showing (A–E) progressive, rapidly reversible decrease in twitch tension and T4/T1 fade ratio at progressively higher concentrations of cyclohexanol, followed by (F) complete recovery on washing with control MPS. (G) Continuous recording of peak tension responses with increasing cyclohexanol concentrations (arrows indicate progressive 5 mM increments) , followed by flushing with MPS (Wash). Upper and lower bounds of the trace indicate the amplitudes of T1 and T4 responses in each TOF response. (H) Continuous recording of peak tension during TOF stimulation showing time course of both decrease in tension and T4/T1 fade ratio following addition of 20 mM cyclohexanol to the recording chamber. (I) Summary data showing cumulative decrease in T1 tension (black symbols) and T4/T1 fade (red symbols) as cyclohexanol concentration was progressively increased in 5 mM increments (as per A–F). Each point shows the mean ± SEM (n = 5 muscles). (J–M) TOF responses of an isolated mouse FDB nerve-muscle preparation incubated in 15 mM cyclohexanol for 10 min at 25 °C (J). The preparation showed only slight decrease in tension and fade; increasing the bathing medium temperature from 30 °C to 32 °C (K,L) was associated with marked decreases. (M) Tension recovered when the bath temperature was restored to 25 °C. (N) Summary data showing the decrease in initial (T1) peak twitch responses (% initial T1 responses) after incubation in cyclohexanol (filled symbols, mean ± S.E.M; n = 4 muscles) versus MPS only (open symbols, n = 6 muscles).
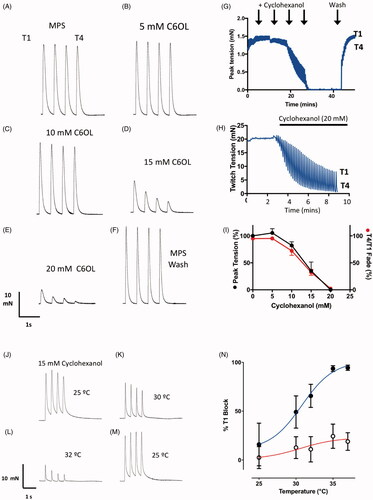
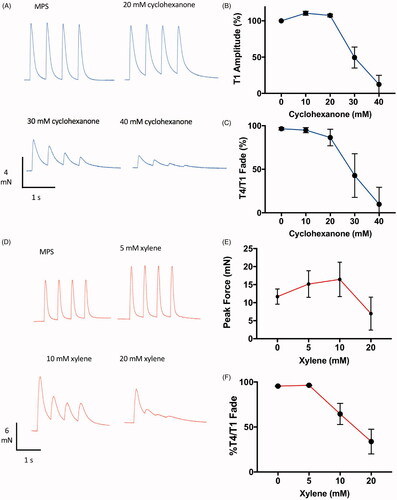
Figure 9. Cyclohexanol and xylene also cause neuromuscular fade and block. Representative TOF responses (A,D) and data summarising effects on peak (T1) amplitude (B,E) and T4/T1 fade (C,F), from isolated mouse FDB muscles with increasing amounts of (A–C) cyclohexanone or (D–F) xylene to the bathing medium. Points on the graphs are means ± SEM for four muscles.