Figures & data
Table 1. Phenthoate properties.
Table 2. Patient outcomes.
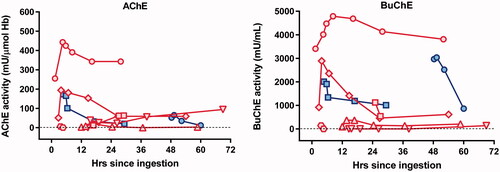
Figure 1. Box violin plots showing distribution of patients’ time from ingestion to first intubation in graph A (n = 37), duration of ventilation in graph B (n = 41), and time to death from ingestion in graph C (n = 19).
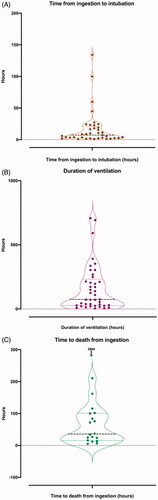
Figure 2. Relationship between time since poisoning and initial plasma phenthoate concentration (ng/ml) for 59 patients. Three outliers [(106, 17), (1.6, 2601) and (1.5, 5257)] are represented with arrows. Patients present with variable amounts of phenthoate concentration in their blood, with an apparent trend towards lower phenthoate concentrations in late presentations.
![Figure 2. Relationship between time since poisoning and initial plasma phenthoate concentration (ng/ml) for 59 patients. Three outliers [(106, 17), (1.6, 2601) and (1.5, 5257)] are represented with arrows. Patients present with variable amounts of phenthoate concentration in their blood, with an apparent trend towards lower phenthoate concentrations in late presentations.](/cms/asset/c79406f0-929b-419d-a027-5653593e5c42/ictx_a_1917596_f0002_b.jpg)
Figure 3. AChE and BuChE activity in 8 patients. Red symbols represent patients receiving pralidoxime. Blue symbols represent patients receiving placebo. Each symbol shape represents a different patient. The graph shows a modest increase in cholinesterase activity in the first hour among 5 out of 6 patients who received pralidoxime.