
Figures & data
Figure 1. Chemical structure of flubromazolam and related benzodiazepines.
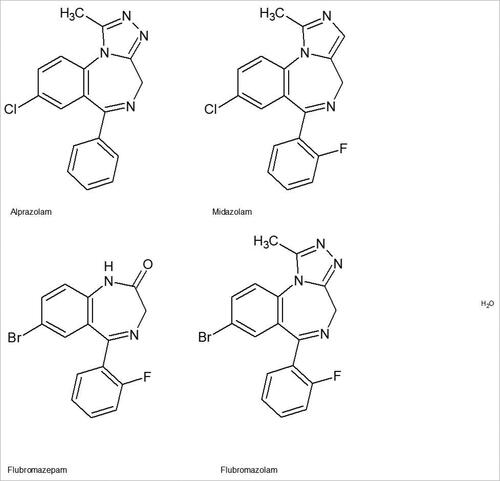
Table 1. Details of cases with analytically confirmed exposure to flubromazolam.
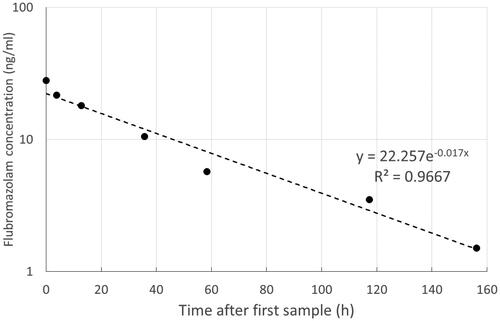
Figure 2. Flubromazolam concentrations (whole blood, log scale) plotted against time after first sample in one participant (case 7) providing multiple blood samples. The equation for the line of best fit and the coefficient of determination (R2) are also provided.
Supplemental material