Figures & data
Table 1. Commercially available descalers and their acidic components and pH as indicated by the manufacturer.
Table 2. Product information of the electric kettle descalers used for pH measurements.
Figure 1. The effect of dilution and addition of milk powder on the pH of different descalers. Cleaning vinegar, descaler 1, 2 and 3 contained acetic acid, hydroxyacetic acid (supplemented with D-gluconic acid), phosphoric acid and sulfamic acid, respectively. Black circles represent solutions without milk powder, black triangles represent solutions containing milk powder (3.33 g/30 mL), all measured at 20 °C. Grey triangles represent calculated pH values based on acetic acid, hydroxyacetic acid, phosphoric acid and sulfamic acid concentrations (undiluted) of respectively 5.7%, 35%, 22% and 18% (m/V). ▲* Represents the measurement of the undiluted sample with milk powder at 37 °C. The y-axis represents the measured pH, the x-axis, in –log10 transformation, represents the dilution factor.
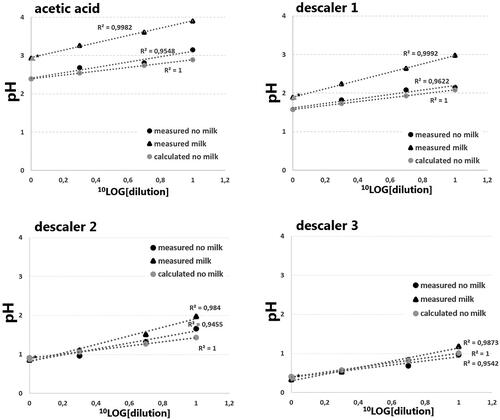
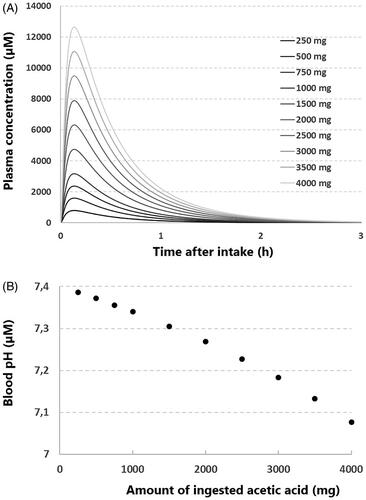
Figure 2. Estimation of blood pH after the ingestion of acetic acid by an infant. (A) The modeled pharmacokinetics of different amounts of ingested acetic acid, using a minimal physiological based pharmacokinetic (PBPK) model (see inlay, ka= 20 (1/h), Vss = 0.5 (L/kg), CLpo = 84.76 (L/h). The y-axis represents the plasma concentration, the x-axis represents the time after ingestion. (B) The calculated blood pH after ingestion of different amounts of acetic acid, using the maximum concentrations of acetic acid depicted in . The y-axis represents the calculated blood pH, the x-axis represents the amount of ingested acetic acid.