
Figures & data
Figure 1. Map of Nepal showing the hospitals and forensic science laboratories from which data were collected. The size of the circle relates to the case number at each site. Created for this publication using Microsoft excel and QGIS version 3.12.3.
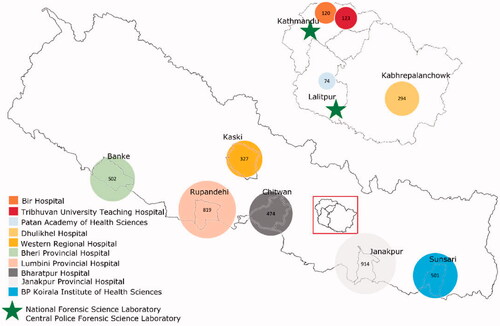
Table 1. Case number and timing by hospital.
Table 2. Outcome of the hospital poisoning cases.
Table 3. Classification of agents responsible for death among hospital cases.
Figure 2. Types of pesticides identified as being responsible for suicides from CPFSL.
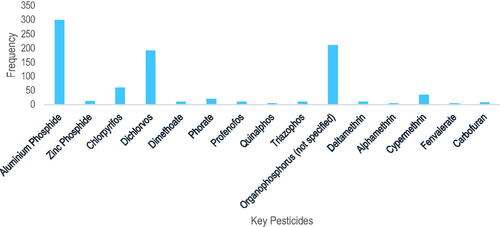
Table 4. Classification of pesticides identified at NFSL.