Figures & data
Figure 1. Trends in age-standardised rates (per 100,000) of (A) pesticide, non-paraquat, and paraquat suicide and (B) overall, non-pesticide, and pesticide suicidea (the dashed lines indicate the estimated suicide rates based on trend in 2011–2017) in Taiwan, 2011–2019. The vertical line indicates the year when the import and production of paraquat was banned (2018, or 1st February 2018 to be exact). aIncluding certified suicides and possible suicides (deaths certified as undetermined intent, accidental suffocation, or accidental pesticide poisoning).
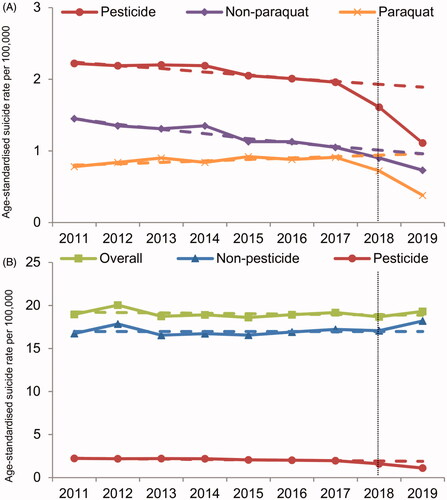
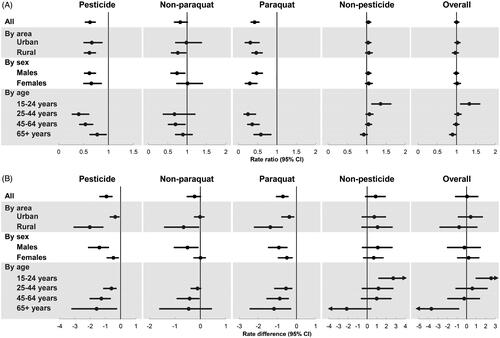
Figure 2. (A) Rate ratios (RRs) and (B) corresponding rate differences (RDs) per 100,000 based on RRs, and their 95% confidence intervals (CIs) of suicide by method (pesticide vs. non-pesticide) and pesticide (paraquat vs. non-paraquat) in 2019 after the paraquat ban in Taiwan. RRs are between the observed rates and the expected rates based on suicide trends 2011–2017 estimated using negative binomial regression models. The import and production of paraquat was banned from 1 February 2018. Note: Rate ratios for pesticide (non-paraquat and paraquat) suicides could not be estimated in people aged 15–24 years due to no cases. aIncluding certified suicides and possible suicides (deaths certified as undetermined intent, accidental suffocation, or accidental pesticide poisoning).