Figures & data
Figure 1. Minipig pulmonary aspiration protocol. Each minipig was anaesthetised approximately 2 h before time = 0 to allow time for surgical placement of arterial, central venous and urinary catheters. The pulmonary surfactant tracer isotope (methyl D9 choline chloride 3.6mg/kg) was infused IV from –30 min for 3h (data not shown). The dots denote sampling points for arterial and venous blood, +/- urine (data not shown). CT of lungs occurred at –30 min, 4, 8, 24, 32 and 47.5 h. The intervention mixtures listed in the table were placed in the right lower lung (RLL) through an epidural catheter placed down the working channel of a bronchoscope (Vision Sciences BRS-5000, Laborie, US) at time = 0. The OP (dimethoate EC40) intervention mixture contained 1/25th a severe poisoning dose used in previous studies [Citation15]. The left lung was isolated during pulmonary instillation through use of a bronchial blocker. Bronchoscopy, bronchoalveolar lavage (BAL) and pulmonary biopsy for both direct (right) and indirect (left) lungs took place at 24.5 h and 48 h, after which the minipig was euthanized. (A) Breathing hoses from Siemens Servo 300A ventilator; (B) bronchoscope dual-axis swivel adapter; (C) bronchial blocker inflation line; (D) endotracheal tube cuff inflater; (E) torque controlled bronchial blocker (TCB; Univent endotracheal tube); (f) right accessory bronchus; (g) bronchial blocker cuff; (h) bronchoscope (BRS-5000). Diagram illustrating the instrumentation used is reproduced from previous work [Citation18]. edc: epidural catheter.
![Figure 1. Minipig pulmonary aspiration protocol. Each minipig was anaesthetised approximately 2 h before time = 0 to allow time for surgical placement of arterial, central venous and urinary catheters. The pulmonary surfactant tracer isotope (methyl D9 choline chloride 3.6mg/kg) was infused IV from –30 min for 3h (data not shown). The dots denote sampling points for arterial and venous blood, +/- urine (data not shown). CT of lungs occurred at –30 min, 4, 8, 24, 32 and 47.5 h. The intervention mixtures listed in the table were placed in the right lower lung (RLL) through an epidural catheter placed down the working channel of a bronchoscope (Vision Sciences BRS-5000, Laborie, US) at time = 0. The OP (dimethoate EC40) intervention mixture contained 1/25th a severe poisoning dose used in previous studies [Citation15]. The left lung was isolated during pulmonary instillation through use of a bronchial blocker. Bronchoscopy, bronchoalveolar lavage (BAL) and pulmonary biopsy for both direct (right) and indirect (left) lungs took place at 24.5 h and 48 h, after which the minipig was euthanized. (A) Breathing hoses from Siemens Servo 300A ventilator; (B) bronchoscope dual-axis swivel adapter; (C) bronchial blocker inflation line; (D) endotracheal tube cuff inflater; (E) torque controlled bronchial blocker (TCB; Univent endotracheal tube); (f) right accessory bronchus; (g) bronchial blocker cuff; (h) bronchoscope (BRS-5000). Diagram illustrating the instrumentation used is reproduced from previous work [Citation18]. edc: epidural catheter.](/cms/asset/e18399ea-3ad1-4410-b46e-af741c735f5d/ictx_a_2028803_f0001_c.jpg)
Figure 2. Effects of pulmonary treatments on red cell AChE, cardiovascular function and lung function. (A) red cell AChE activity (relative to Hb concentration, normalized to baseline) showing effect of OP insecticide in the OP + GJ group; (B) arterial plasma lactate concentration (mmol/L) and (C) arterial pH showing no cardiovascular effects of the instilled mixtures; (D) PaO2/FiO2 ratios and (E) plateau airway pressures (Pplat). By 48 h, the intervention groups had developed a mild-moderate acute respiratory distress syndrome (ARDS) with PaO2/FiO2 ratios of 227 (±65) mmHg, 203 (±69) mmHg and 232 (±171) mmHg for OP + GJ (n = 4), G (n = 5) and Solv + GJ-treated pigs (n = 5) respectively (compared to 385 (±70) mmHg (sham bronchoscopy, n = 5), 317 (±166) mmHg (saline controls, n = 5) NB. The PaO2, pH and lactate data for one OP+GJ pig at 47.5 h was missing likely due to equipment failure. For presentation, Figures 2D and 2E omit data between 24–48 h from one saline pig that developed a pneumothorax. Please see online methods supplement for more information on data management. The graphs show mean with SD.
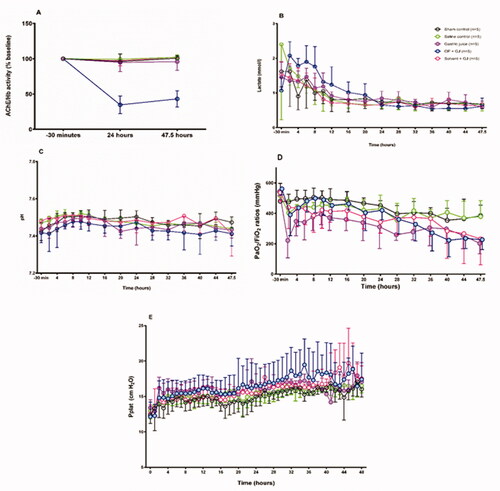
Table 1. Cardiovascular physiological data.
Figure 3. Effects of pulmonary treatments on BALF and plasma markers of inflammation. (A): BALF cellular contents from a representative OP + GJ directly-injured (right) lung at 48 h. This cytospin image shows the presence of numerous neutrophils with the occasional alveolar macrophage. Many red blood cells can also be seen. Cells have been stained with Diffquik® (image taken using Olympus slide scanner VS120 at 20×). (B) The presence of red blood cells in the BALF from minipigs receiving pulmonary treatments. Percentage of red blood cells (RBC) in a count of 100 cells within the BALF of samples at 24 and 48 h in the (B–A) directly-injured and (B-B) indirectly-injured lungs. No statistical significance was found between groups. (C) Protein concentrations in the BALF of minipigs receiving pulmonary treatments. BALF total protein in (C–A) directly-injured and (C–B) indirectly-injured lungs at 24 and 48 h. There was a significant difference between directly-injured lung groups at both time points, but not indirectly-injured lungs. The asterisks indicate that there was significant difference between directly- and indirectly-injured lungs of GJ and Solv + GJ pigs at 24 h. (D) BALF interleukin 8 (IL-8) concentrations in (D–A) directly and (D–B) indirectly-injured lungs at 24 and 48 h. There was a significant difference for both directly- and indirectly-injured lung groups at 24 h but not 48 h. Comparisons between directly- and indirectly-injured lungs found that IL-8 was significantly lower in the indirectly-injured lungs of GJ and solv + GJ pigs (asterisks no bar). (E) BALF interleukin 6 (IL-6) concentrations in (E–A) directly-injured and (E–B) indirectly-injured lungs at 24 and 48 h. Only directly-injured lungs at 24 h were significantly different between groups. Comparisons between directly- and indirectly-injured lungs found that IL-6 was significantly lower in the indirectly-injured lung of only GJ pigs at 24 h (asterisk no bar). (F) BALF C-reactive protein (CRP) concentrations in (F-A) directly-injured and (F-B) indirectly-injured lungs at 24 and 48 h. There was a significant difference between directly-injured lung groups at 24 h, and directly and indirectly-injured lungs at 48 h. Comparisons between directly and indirectly-injured lungs found that CRP were significantly lower in the indirectly-injured lung of only GJ pigs at 24 h (asterisk no bar). (B–F) show mean and SD. When there were significant differences between sham control and a treatment group in the indirectly-injured lungs, these were illustrated on the graph ( Right panel; 3F–B Right panel).
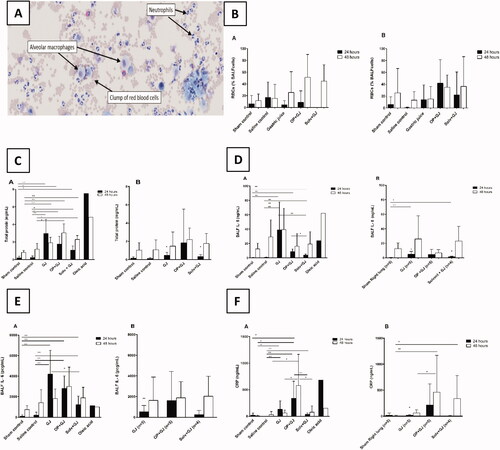
Figure 4. Lung injury caused by instillation of OP + GJ shown through serial CT scans and lung density analysis. Serial CT scans of an OP + GJ pig before (A) and after (B–F) instillation of a mixture of OP + GJ into the right lung of a minipig at time = 0, with voxel density analysis of the directly-injured (G) and indirectly-injured (H) lungs over time. Panel I shows only the non-aerated voxels (–250 to +250 HU) 47.5 h after instillation of OP + GJ in the right, directly-injured lung compared with the left, indirectly-injured lung. By 4 h (B), there is an obvious right-sided lower area of consolidation which enlarges over time to involve most of the right lung by 24 h (D) with a large pleural effusion seen in the fissure (arrow). By 32 h, the contralateral left lung is also involved showing dorsal consolidation (E) which worsens with bilateral pleural effusions at 47.5 h (F). The right lung recovers slightly at this time with more aeration sub-sternally (anteriorly). Indirectly-injured (left) lung (H) is represented in red, directly-injured (right) lung (G) in green in the online version. Directly-injured lung has a peak amount of poorly aerated lung at 32 h, which then reduces a little by 47.5 h, mirroring the CT images. The indirectly-injured lung has less volume than the contralateral lung at baseline, hence the smaller peaks. However, the spread of voxels shows a good proportion of well-ventilated, aerated lung at 47.5 h, unlike in the directly-injured lung.
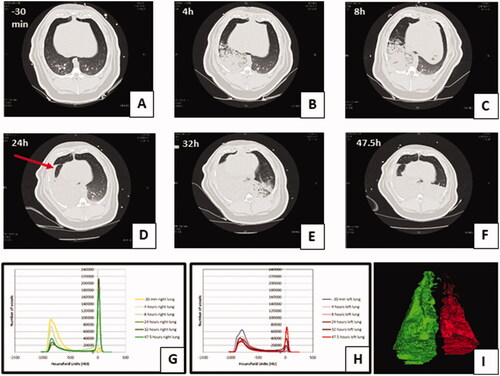
Figure 5. Change in proportion of poorly/non-aerated lung tissue over time by groups. Graphs showing the mean ± SEM percentage of poorly/non-aerated lung tissue (–499 to +250 HU) from (A) directly-injured right and (B) indirectly-injured left lungs over 48 h. Individual lung data are shown in dot plots for the (C) directly-injured right and (D) indirectly-injured left lungs over 48 h. Data from one saline control pig left lung at 32 h has been omitted because of a large pneumothorax which was drained before the pigs 47.5 h CT scan.
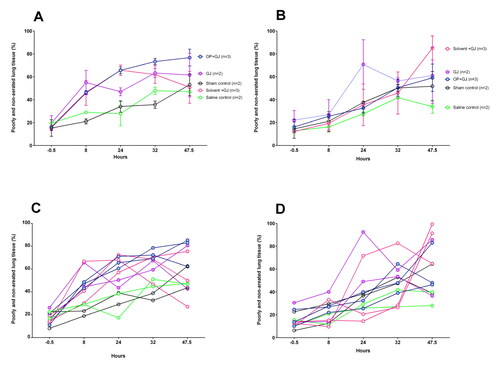
Table 2. Percentage (mean ± SD) of poorly and non-aerated lung tissue in the directly-injured lung at time –30 min, 24 and 47.5 h.
Figure 6. Effects of pulmonary instillation of mixtures of GJ, OP + GJ and Solv + GJ on minipig lung. Comparison of histopathological pig lung architecture in representative sections 48 h after sham bronchoscopy (A/B), administration of saline (D/E), GJ (G/H), OP + GJ (J/K) or Solv + GJ (M/N) into directly-injured right lower lungs. Direct injury with GJ and with OP + GJ caused alveolar and interstitial oedema, neutrophil infiltration, haemorrhage, fibrin deposition, vascular congestion, and necrosis. Haemorrhage and necrosis were more pronounced in the OP + GJ lungs while Solv + GJ caused less lung injury. On electron microscopy, direct injury with GJ, OP + GJ and Solv + GJ shows some alveolar capillary membrane swelling; the alveolar membrane component peels off into the alveolar space in GJ and OP + GJ groups. OP + GJ also led to fibrin deposition (arrows) in and around the alveolar capillary membrane. In lungs indirectly-injured by GJ (I) and OP + GJ (L), alveolar injury can be seen. Images edited in PowerPoint (Microsoft 2020). Original magnification: 20× for light microscopy, 25,000× for electron microscopy. ACM: alveolar capillary membrane; RBC: red blood cell.
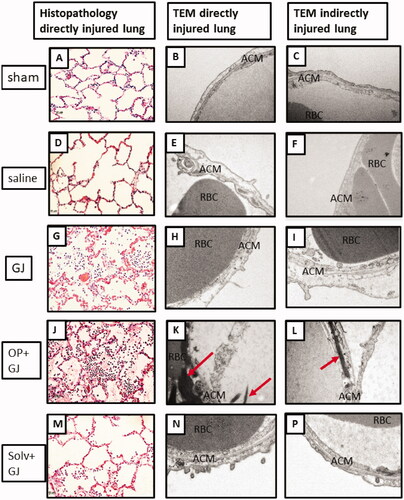
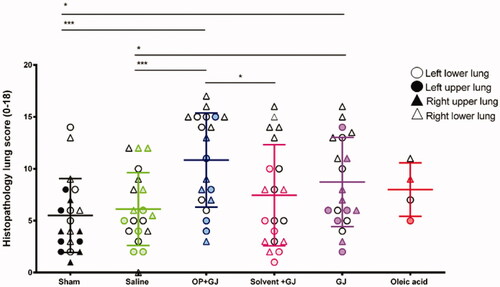
Figure 7. Dot plot showing the spread of histopathology scores in cranial and caudal (upper and lower) parts of the lung in all groups. Triangles indicate directly-injured right lungs, circles indicate indirectly-injured left lungs. Empty triangles or circles denote lower, as opposed to upper, lung samples. Most severe injury was noted in the directly-injured right caudal (lower) lung samples (empty triangles) in the intervention groups. Mean and SD shown.